Pulse-Doppler signal processing is a radar and CEUS performance enhancement strategy that allows small high-speed objects to be detected in close proximity to large slow moving objects. Detection improvements on the order of 1,000,000:1 are common. Small fast moving objects can be identified close to terrain, near the sea surface, and inside storms.
This signal processing strategy is used in pulse-Doppler radar and multi-mode radar, which can then be pointed into regions containing a large number of slow-moving reflectors without overwhelming computer software and operators. Other signal processing strategies, like moving target indication, are more appropriate for benign clear blue sky environments.
It is also used to measure blood flow in Doppler ultrasonography.
Environment
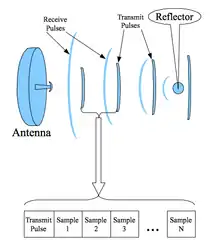
Pulse-Doppler begins with coherent pulses transmitted through an antenna or transducer.
There is no modulation on the transmit pulse. Each pulse is a perfectly clean slice of a perfect coherent tone. The coherent tone is produced by the local oscillator.
There can be dozens of transmit pulses between the antenna and the reflector. In a hostile environment, there can be millions of other reflections from slow moving or stationary objects.
Transmit pulses are sent at the pulse repetition frequency.
Energy from the transmit pulses propagate through space until they are disrupted by reflectors. This disruption causes some of the transmit energy to be reflected back to the radar antenna or transducer, along with phase modulation caused by motion. The same tone that is used to generate the transmit pulses is also used to down-convert the received signals to baseband.
The reflected energy that has been down-converted to baseband is sampled.
Sampling begins after each transmit pulse is extinguished. This is the quiescent phase of the transmitter.
The quiescent phase is divided into equally spaced sample intervals. Samples are collected until the radar begins to fire another transmit pulse.
The pulse width of each sample matches the pulse width of the transmit pulse.
Enough samples must be taken to act as the input to the pulse-Doppler filter.
Sampling
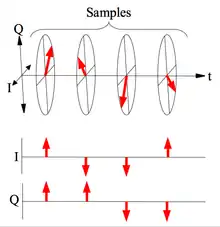
The local oscillator is split into two signals that are offset by 90 degrees, and each is mixed with the received signal. This mixing produces I(t) and Q(t). Phase coherence of the transmit signal is crucial for pulse-Doppler operation. In the diagram, the top shows phases of the wave-front in I/Q.
Each of the disks shown in this diagram represent a single sample taken from multiple transmit pulses, i.e. the same sample offset by the transmit period (1/PRF). This is the ambiguous range. Each sample would be similar but delayed by one or more pulse widths behind those that are shown. The signals in each sample are composed of signals from reflections at multiple ranges.
The diagram shows a counterclockwise spiral, which corresponds with inbound motion. This is up-Doppler. Down-Doppler would produce a clockwise spiral.
Windowing
The process of digital sampling causes ringing in the filters that are used to remove reflected signals from slow moving objects. Sampling causes frequency sidelobes to be produced adjacent to the true signal for an input that is a pure tone. Windowing suppresses sidelobes induced by the sampling process.
The window is the number of samples that are used as an input to the filter.
The window process takes a series of complex constants and multiplies each sample by its corresponding window constant before the sample is applied to the filter.
Dolph–Chebychev windowing provides optimal processing sidelobe suppression.
Filtering
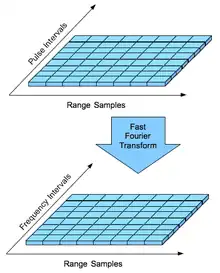
Pulse-Doppler signal processing separates reflected signals into a number of frequency filters. There is a separate set of filters for each ambiguous range. The I and Q samples described above are used to begin the filtering process.
These samples are organized into the m × n matrix of time domain samples shown in the top half of the diagram.
Time domain samples are converted to frequency domain using a digital filter. This usually involves a fast Fourier transform (FFT). Side-lobes are produced during signal processing and a side-lobe suppression strategy, such as Dolph–Chebyshev window function, is required to reduce false alarms .[1]
All of the samples taken from the Sample 1 sample period form the input to the first set of filters. This is the first ambiguous range interval.
All of the samples taken from the Sample 2 sample period form the input to the second set of filters. This is the second ambiguous range interval.
This continues until samples taken from the Sample N sample period form the input to the last set of filters. This is the furthest ambiguous range interval.
The outcome is that each ambiguous range will produce a separate spectrum corresponding with all of the Doppler frequencies at that range.
The digital filter produces as many frequency outputs as the number of transmit pulses used for sampling. Production of one FFT with 1024 frequency outputs requires 1024 transmit pulses for input.
Detection
Detection processing for pulse-Doppler produces an ambiguous range and ambiguous velocity corresponding to one of the FFT outputs from one of the range samples. The reflections fall into filters corresponding to different frequencies that separate weather phenomenon, terrain, and aircraft into different velocity zones at each range.
Multiple simultaneous criteria are required before a signal can qualify as a detection.
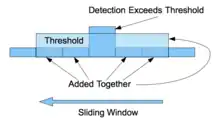
Constant false alarm rate processing is used to examine each FFT output to detect signals. This is an adaptive process that adjusts automatically to background noise and environmental influences. There is a cell under test, where the surrounding cells are added together, multiplied by a constant, and used to establish a threshold.
The area surrounding the detection is examined to determine when the sign of the slope changes from to , which is the location of the detection (the local maximum). Detections for a single ambiguous range are sorted in order of descending amplitude.
Detection only covers the velocities that exceed the speed rejection setting. For example, if speed rejection is set to 75 mile/hour, then hail moving at 50 mile/hour inside a thunderstorm will not be detected, but an aircraft moving at 100 mile/hour will be detected.
For monopulse radar, signal processing is identical for the main lobe and sidelobe blanking channels. This identifies if the object location is in the main lobe or if it is offset above, below, left or right of the antenna beam.
Signals that satisfy all of these criteria are detections. These are sorted in order of descending amplitude (greatest to smallest).
The sorted detections are processed with a range ambiguity resolution algorithm to identify the true range and velocity of the target reflection.
Ambiguity resolution
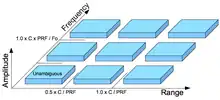
Pulse Doppler radar may have 50 or more pulses between the radar and the reflector.
Pulse Doppler relies on medium pulse repetition frequency (PRF) from about 3 kHz to 30 kHz. Each transmit pulse is separated by 5 km to 50 km distance.
Range and speed of the target are folded by a modulo operation produced by the sampling process.
True range is found using the ambiguity resolution process.
The received signals from multiple PRF are compared using the range ambiguity resolution process.
The received signals are also compared using the frequency ambiguity resolution process.
Lock
The velocity of the reflector is determined by measuring the change in the range of reflector over a short span of time. This change in range is divided by the time span to determine velocity.
The velocity is also found using the Doppler frequency for the detection.
The two are subtracted, and the difference is averaged briefly.
If the average difference falls below a threshold, then the signal is a lock.
Lock means that the signal obeys Newtonian mechanics. Valid reflectors produce a lock. Invalid signals do not. Invalid reflections include things like helicopter blades, where Doppler does not correspond with the velocity that the vehicle is moving through the air. Invalid signals include microwaves made by sources separate from the transmitter, such as radar jamming and deception.
Reflectors that do not produce a lock signal cannot be tracked using the conventional technique. This means the feedback loop must be opened for objects like helicopters because the main body of the vehicle can be below the rejection velocity (only the blades are visible).
Transition to track is automatic for detections that produce a lock.
Transition to track is normally manual for non-Newtonian signal sources, but additional signal processing can be used to automate the process. Doppler velocity feedback must be disabled in the vicinity of the signal source to develop track data.
Track
Track mode begins when a detection is sustained in a specific location.
During track, the XYZ position of the reflector is determined using a Cartesian coordinate system, and the XYZ velocity of the reflector is measured to predict future position. This is similar to the operation of a Kalman filter. The XYZ velocity is multiplied by the time between scans to determine each new aiming point for the antenna.
The radar uses a polar coordinate system. The track position is used to determine the left-right and up-down aiming point for the antenna position in the future. The antenna must be aimed at the position which will paint the target with maximum energy and not dragged behind it, otherwise the radar will be less effective.
The estimated distance to a reflector is compared with the measured distance. The difference is the distance error. Distance error is a feedback signal used to correct the position and velocity information for the track data.
Doppler frequency provides an additional feedback signal similar to the feedback used in a phase-locked loop. This improves the accuracy and reliability of the position and velocity information.
The amplitude and phase for the signal returned by the reflector is processed using monopulse radar techniques during track. This measures the offset between the antenna pointing position and the position of object. This is called angle error.
Each separate object must have its own independent track information. This is called track history, and this extends back for a brief span of time. This could be as much as an hour for airborne objects. The timespan for underwater objects may extend back a week or more.
Tracks where the object produces a detection are called active tracks.
The track is continued briefly in the absence of any detections. Tracks with no detections are coasted tracks. The velocity information is used to estimate antenna aiming positions. These are dropped after a brief period.
Each track has a surrounding capture volume, approximately the shape of a football. The radius of the capture volume is approximately the distance the fastest detectable vehicle can travel between successive scans of that volume, which is determined by the receiver band pass filter in pulse-Doppler radar.
New tracks that fall within the capture volume of a coasted track are cross correlated with the track history of the nearby coasted track. If position and speed are compatible, then the coasted track history is combined with the new track. This is called a join track.
A new track within the capture volume of an active track is called a split track.
Pulse-Doppler track information includes object area, errors, acceleration, and lock state, which are part of the decision logic involving join tracks and split tracks.
Other strategies are used for objects that do not satisfy Newtonian physics.
Users are generally presented with several displays that show information from track data and raw detected signals.
- Plan position indicator
- Scrolling notifications for new tracks, split tracks, and join tracks
- Range amplitude display
- Range height indicator
- Angle error display
The plan position indicator and scrolling notifications are automatic and require no user action. The remaining displays activate to show additional information only when a track is selected by the user.
References
- ↑ "Dolph–Chebyshev Window". Stanford University. Retrieved January 29, 2011.