Torbay Council is the local authority for the unitary authority of Torbay in Devon, England. Until 1 April 1998 it was a non-metropolitan district. From 2005 to 2019 it had a directly elected mayor. The council is elected every four years.
Council elections
Non-metropolitan district elections
- 1973 Torbay Borough Council election
- 1976 Torbay Borough Council election
- 1979 Torbay Borough Council election
- 1983 Torbay Borough Council election (New ward boundaries)[1]
- 1984 Torbay Borough Council election
- 1986 Torbay Borough Council election
- 1987 Torbay Borough Council election
- 1988 Torbay Borough Council election
- 1990 Torbay Borough Council election
- 1991 Torbay Borough Council election[2]
- 1995 Torbay Borough Council election
Unitary authority elections
- 1997 Torbay Council election
- 2000 Torbay Council election
- 2003 Torbay Council election (New ward boundaries)[3][4]
- 2007 Torbay Council election
- 2011 Torbay Council election
- 2015 Torbay Council election
- 2019 Torbay Council election
- 2023 Torbay Council election
Mayoral elections
A referendum took place on 14 July 2005 on establishing a directly elected mayor. The result saw a majority in favour with 18,074 in support and 14,684 opposed on a 32.1% turnout.[5]
- 2005 Torbay Council mayoral election
- 2011 Torbay Council mayoral election
- 2015 Torbay Council mayoral election
A referendum took place on 5 May 2016 on reverting to a leader and cabinet system. The result saw a majority in favour of a leader and cabinet system with 15,846 votes in support of the leader and cabinet system and 9,511 wanting to stick with an elected mayor, on a 25.3% turnout.[6]
Borough result maps
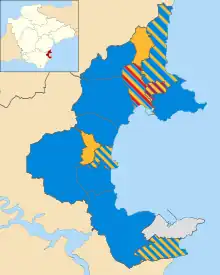 2011 results map
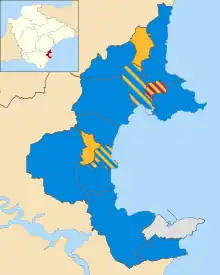 2015 results map
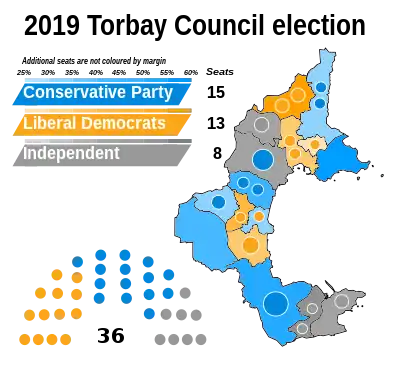 2019 results map
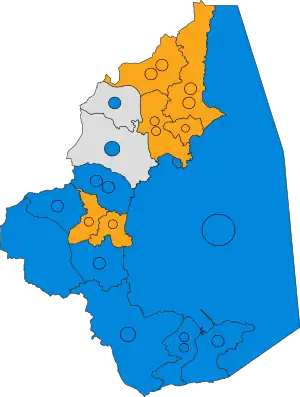 2023 results map
By-election results
1997–2000
| Party | Candidate | Votes | % | ±% | |
|---|---|---|---|---|---|
| Conservative | 1,380 | 46.3 | +10.9 | ||
| Liberal Democrats | 884 | 29.7 | -2.4 | ||
| Independent | 521 | 17.5 | -3.5 | ||
| Labour | 195 | 6.5 | -5.0 | ||
| Majority | 469 | 16.6 | |||
| Turnout | 2,980 | 35.0 | |||
| Conservative gain from Liberal Democrats | Swing | ||||
| Party | Candidate | Votes | % | ±% | |
|---|---|---|---|---|---|
| Conservative | Damian Barton | 671 | 38.2 | +5.9 | |
| Liberal Democrats | Jennifer Faulkner | 667 | 38.0 | -5.3 | |
| Labour | Darren Cowell | 321 | 18.3 | -6.1 | |
| Liberal | 97 | 5.5 | +5.5 | ||
| Majority | 4 | 0.2 | |||
| Turnout | 1,756 | ||||
| Conservative gain from Liberal Democrats | Swing | ||||
| Party | Candidate | Votes | % | ±% | |
|---|---|---|---|---|---|
| Conservative | 1,504 | 51.4 | +16.0 | ||
| Liberal Democrats | 1,129 | 38.6 | +6.5 | ||
| Labour | 295 | 10.1 | -1.4 | ||
| Majority | 375 | 12.8 | |||
| Turnout | 2,928 | 34.0 | |||
| Conservative gain from Liberal Democrats | Swing | ||||
2000–2003
| Party | Candidate | Votes | % | ±% | |
|---|---|---|---|---|---|
| Liberal Democrats | Andrew Blake | 1,151 | 62.9 | +32.9 | |
| Conservative | David Selley | 546 | 29.8 | -7.2 | |
| Labour | Pauline Digby | 94 | 5.1 | +0.0 | |
| Independent | Lionel Digby | 40 | 2.2 | +2.2 | |
| Majority | 605 | 33.1 | |||
| Turnout | 1,831 | 24.7 | |||
| Liberal Democrats gain from Conservative | Swing | ||||
| Party | Candidate | Votes | % | ±% | |
|---|---|---|---|---|---|
| Liberal Democrats | Christopher Harris | 1,201 | 63.4 | -26.3 | |
| Conservative | 557 | 29.6 | -10.9 | ||
| Labour | 121 | 6.4 | -5.6 | ||
| Majority | 644 | 33.8 | |||
| Turnout | 1,879 | 25.5 | |||
| Liberal Democrats gain from Conservative | Swing | ||||
2003–2007
| Party | Candidate | Votes | % | ±% | |
|---|---|---|---|---|---|
| Conservative | Joseph Carroll | 498 | 29.3 | -2.3 | |
| Liberal Democrats | Andrew Douglas-Dunbar | 413 | 24.3 | -24.7 | |
| Independent | Alan Hall | 203 | 11.9 | +4.6 | |
| Labour | David Pedrick-Friend | 203 | 11.9 | -0.1 | |
| UKIP | Mark Dent | 128 | 7.5 | +7.5 | |
| BNP | Michael Turner | 106 | 6.2 | +6.2 | |
| Independent | Pamela Neale | 85 | 5.0 | +5.0 | |
| Independent | Mary Bennett | 63 | 3.7 | +3.7 | |
| Majority | 85 | 5.0 | |||
| Turnout | 1,699 | 31.2 | |||
| Conservative gain from Liberal Democrats | Swing | ||||
| Party | Candidate | Votes | % | ±% | |
|---|---|---|---|---|---|
| Conservative | 964 | ||||
| Conservative | 923 | ||||
| UKIP | 545 | ||||
| UKIP | 482 | ||||
| Liberal Democrats | Tristan Gruber | 198 | |||
| Liberal Democrats | Thomas Pentney | 192 | |||
| Labour | 102 | ||||
| Labour | 89 | ||||
| Turnout | 3,496 | 27.6 | |||
| Conservative hold | Swing | ||||
| Party | Candidate | Votes | % | ±% | |
|---|---|---|---|---|---|
| Conservative | Colin Hurst | 701 | 42.2 | +10.5 | |
| Liberal Democrats | Thomas Pentney | 510 | 30.7 | -27.9 | |
| UKIP | Mark Dent | 284 | 17.1 | +7.4 | |
| Labour | John Mellor | 116 | 7.0 | +7.0 | |
| BNP | Michael Turner | 50 | 3.0 | +3.0 | |
| Majority | 191 | 11.5 | |||
| Turnout | 1,661 | 30.9 | |||
| Conservative gain from Liberal Democrats | Swing | ||||
| Party | Candidate | Votes | % | ±% | |
|---|---|---|---|---|---|
| Conservative | John Hanley | 1,261 | 62.5 | +8.5 | |
| Liberal Democrats | Jefferson Rose | 331 | 16.4 | +5.2 | |
| UKIP | Mark Dent | 326 | 16.1 | -13.3 | |
| Labour | Thomas Millman | 99 | 4.9 | -0.6 | |
| Majority | 930 | 46.1 | |||
| Turnout | 2,017 | 29.6 | |||
| Conservative hold | Swing | ||||
| Party | Candidate | Votes | % | ±% | |
|---|---|---|---|---|---|
| Conservative | Jeanette Richards | 1,708 | 38.9 | +18.9 | |
| Liberal Democrats | Alan Forbes | 1,563 | 35.6 | -14.1 | |
| Labour | Jonathan Haines | 1,124 | 25.6 | +7.4 | |
| Majority | 145 | 3.3 | |||
| Turnout | 4,395 | 57.8 | |||
| Conservative gain from Liberal Democrats | Swing | ||||
| Party | Candidate | Votes | % | ±% | |
|---|---|---|---|---|---|
| Conservative | Derek Mills | 1,250 | 77.7 | +27.4 | |
| Liberal Democrats | Andrew Douglas-Dunbar | 270 | 16.8 | -32.9 | |
| Labour | Trevor Fine | 89 | 5.5 | +5.5 | |
| Majority | 980 | 60.9 | |||
| Turnout | 1,609 | 28.3 | |||
| Conservative hold | Swing | ||||
2007–2011
| Party | Candidate | Votes | % | ±% | |
|---|---|---|---|---|---|
| Independent | Michael Morey | 1,006 | |||
| Independent | Vic Ellery | 952 | |||
| Conservative | Martyn Hodge | 853 | |||
| Conservative | Simon Jones | 727 | |||
| Conservative | Alan Craig | 689 | |||
| Independent | Tony Walker | 510 | |||
| Liberal Democrats | Chris Lomas | 483 | |||
| Independent | Nigel James | 397 | |||
| Liberal Democrats | Catherine Johns | 277 | |||
| Liberal Democrats | John Turner | 245 | |||
| BNP | Michael Turner | 159 | |||
| BNP | Maureen Turner | 152 | |||
| BNP | Chris Marchant | 151 | |||
| UKIP | Gary Booth | 145 | |||
| UKIP | Peter Fryett | 129 | |||
| UKIP | Mike Simpson | 93 | |||
| Labour | Patrick Canavan | 71 | |||
| Labour | Jermaine Atiya-Alla | 67 | |||
| Labour | Irene Reade | 66 | |||
| Turnout | 7,172 | 31.8 | |||
| Independent gain from Liberal Democrats | Swing | ||||
| Independent gain from Conservative | Swing | ||||
| Conservative hold | Swing | ||||
| Party | Candidate | Votes | % | ±% | |
|---|---|---|---|---|---|
| Liberal Democrats | Andrew Baldrey | 801 | 52.7 | ||
| Conservative | Nicholas Henderson | 365 | 24.0 | ||
| Labour | Rosemary Ann Clarke | 195 | 12.8 | ||
| UKIP | Jen Walsh | 159 | 10.5 | ||
| Majority | |||||
| Turnout | 2,017 | 1,520 | |||
| Liberal Democrats gain from Conservative | Swing | ||||
2011–2015
| Party | Candidate | Votes | % | ±% | |
|---|---|---|---|---|---|
| Liberal Democrats | Mark Pountney | 1,048 | 46.3 | ||
| Conservative | Sylvia Faryna | 614 | 27.1 | ||
| Labour | Leonora Critchlow | 357 | 15.8 | ||
| Independent | Susie Colley | 129 | 5.7 | ||
| Independent | Mark Dent | 61 | 2.7 | ||
| Green | Thomas Cooper | 55 | 2.4 | ||
| Majority | |||||
| Turnout | 2,264 | 26.3 | |||
| Liberal Democrats gain from Conservative | Swing | ||||
2015–2019
| Party | Candidate | Votes | % | ±% | |
|---|---|---|---|---|---|
| Liberal Democrats | Adrian Sanders | 1,096 | 69.2 | +39.3 | |
| Conservative | Richard Barnby | 234 | 14.8 | -13.7 | |
| UKIP | Anthony Rayner | 158 | 10.0 | -9.7 | |
| Labour | Eddie Harris | 53 | 3.3 | -9 | |
| Green | Stephen Pocock | 43 | 2.7 | -6.8 | |
| Majority | 862 | 54.4 | +53 | ||
| Turnout | 1,584 | 27.6 | |||
| Liberal Democrats hold | Swing | +26.5 | |||
| Party | Candidate | Votes | % | ±% | |
|---|---|---|---|---|---|
| Liberal Democrats | Nicholas Pentney | 1,126 | 46.7 | ||
| Conservative | Jacqueline Wakeham | 533 | 22.1 | ||
| Labour | Darren Cowell | 344 | 14.3 | ||
| UKIP | Steven Walsh | 315 | 13.1 | ||
| Green | Stephen Morley | 66 | 2.7 | ||
| TUSC | Michelle Goodman | 27 | 1.1 | ||
| Majority | 593 | 24.6 | |||
| Turnout | 2,411 | 29.8 | |||
| Liberal Democrats gain from Conservative | Swing | ||||
| Party | Candidate | Votes | % | ±% | |
|---|---|---|---|---|---|
| Liberal Democrats | Swithin Long | 655 | 57.1 | ||
| Conservative | Daniel Maddock | 355 | 30.9 | ||
| Labour | Julia Neal | 121 | 9.5 | ||
| Green | Eleanor Taylor | 17 | 1.4 | ||
| Majority | 300 | 26.1 | |||
| Turnout | 1,148 | 22.3 | |||
| Liberal Democrats hold | Swing | ||||
2019–2023
| Party | Candidate | Votes | % | ±% | |
|---|---|---|---|---|---|
| Conservative | Jane Barnby | 892 | 49.3 | +21.7 | |
| Liberal Democrats | Dennis Shearman | 641 | 35.5 | +4.8 | |
| Brexit Party | Eddie Davis | 168 | 9.3 | +9.3 | |
| Labour | Catherine Fritz | 72 | 4.0 | -2.3 | |
| Green | Jane Hughes | 35 | 1.9 | -7.5 | |
| Majority | 251 | 13.9 | |||
| Turnout | 1,808 | ||||
| Conservative gain from Liberal Democrats | Swing | ||||
| Party | Candidate | Votes | % | ±% | |
|---|---|---|---|---|---|
| Liberal Democrats | Cat Johns | 1,014 | 45.8 | +4.7 | |
| Conservative | John Fellows | 983 | 44.4 | +17.6 | |
| Labour | Andy Symons | 149 | 6.7 | -0.8 | |
| Green | Sue Kenning | 69 | 3.1 | -9.7 | |
| Majority | 31 | 1.4 | |||
| Turnout | 2,215 | ||||
| Liberal Democrats hold | Swing | ||||
References
- ↑ legislation.gov.uk - The Borough of Torbay (Electoral Arrangements) Order 1979. Retrieved on 19 November 2015.
- ↑ legislation.gov.uk - The Borough of Torbay (Electoral Arrangements) Order 1987. Retrieved on 4 November 2015.
- ↑ "Local elections". * BBC News Online. Retrieved 11 September 2009.
- ↑ legislation.gov.uk - The Borough of Torbay (Electoral Changes) Order 2002. Retrieved on 4 October 2015.
- ↑ "Totals so far". guardian.co.uk. London. Archived from the original on 12 April 2008. Retrieved 11 September 2009.
- ↑ "Mayoral System Referendum". Torbay: www.torbay.gov.uk. Archived from the original on 12 April 2017. Retrieved 11 September 2016.
- ↑ "Torbay Borough Council Casual Election 7th December 2000" (PDF). Torbay Council. Retrieved 11 September 2009.
- ↑ "Labour regains Burnley". guardian.co.uk. London. 30 November 2001. Retrieved 11 September 2009.
- ↑ "Roundham with Hyde By-Election" (PDF). Torbay Council. Retrieved 11 September 2009.
- ↑ "Tories keep seats despite Ukip vote surge". guardian.co.uk. London. 6 August 2004. Retrieved 11 September 2009.
- ↑ "Labour wins byelection in army town". guardian.co.uk. London. 22 October 2004. Retrieved 11 September 2009.
- ↑ "Candidates named for by-election". BBC News Online. 25 September 2004. Retrieved 11 September 2009.
- ↑ "Declaration of result of poll" (PDF). Torbay Council. Retrieved 11 September 2009.
- ↑ "Declaration of result of poll" (PDF). Torbay Council. Retrieved 11 September 2009.
- ↑ "Declaration of result of poll" (PDF). Torbay Council. Retrieved 11 September 2009.
- ↑ "Declaration of result of poll". Torbay Council. Retrieved 11 September 2009.
- ↑ "Declaration of result of poll". Torbay Council. Retrieved 30 May 2011.
- ↑ "Declaration of result of poll". Torbay Council. Retrieved 24 June 2011.
- ↑ "DECLARATION OF RESULT OF POLL, Torbay Council local election on Thursday 5 November 2015, Result of poll for the Clifton with Maidenway ward" (Microsoft Word). Torbay Council. Retrieved 3 September 2016.
- ↑ "DECLARATION OF RESULT OF POLL, Torbay Borough Election of a Borough Councillor for Tormohun on Thursday 5 May 2016" (Microsoft Word). Torbay Council. Retrieved 3 September 2016.
- ↑ "DECLARATION OF RESULT OF POLL, Torbay Borough Election of a Borough Councillor for Watcombe on Thursday 14 December 2017" (Microsoft Word). Torbay Council. Retrieved 15 December 2017.
- ↑ "Local Elections Archive Project — Goodrington with Roselands Ward". www.andrewteale.me.uk. Retrieved 29 September 2023.
- ↑ "Local Elections Archive Project — Clifton with Maidenway Ward". www.andrewteale.me.uk. Retrieved 29 September 2023.
External links

This article is issued from Wikipedia. The text is licensed under Creative Commons - Attribution - Sharealike. Additional terms may apply for the media files.