Wokingham Borough Council is the local authority for the Borough of Wokingham, a unitary authority in Berkshire, England. Until 1 April 1998 it was a non-metropolitan district.
Council elections
Non-metropolitan district elections
- 1973 Wokingham District Council election
- 1976 Wokingham District Council election
- 1979 Wokingham District Council election (New ward boundaries)[1]
- 1980 Wokingham District Council election
- 1982 Wokingham District Council election
- 1983 Wokingham District Council election
- 1984 Wokingham District Council election
- 1986 Wokingham District Council election
- 1987 Wokingham District Council election
- 1988 Wokingham District Council election
- 1990 Wokingham District Council election
- 1991 Wokingham District Council election (District boundary changes took place but the number of seats remained the same)[2]
- 1992 Wokingham District Council election
- 1994 Wokingham District Council election
- 1995 Wokingham District Council election
- 1996 Wokingham District Council election
Unitary authority elections
- 1997 Wokingham District Council election
- 1999 Wokingham District Council election
- 2000 Wokingham District Council election
- 2001 Wokingham District Council election
- 2002 Wokingham District Council election
- 2003 Wokingham District Council election
- 2004 Wokingham District Council election (New ward boundaries)[3][4][5]
- 2006 Wokingham District Council election
- 2007 Wokingham District Council election
- 2008 Wokingham Borough Council election
- 2010 Wokingham Borough Council election
- 2011 Wokingham Borough Council election
- 2012 Wokingham Borough Council election
- 2014 Wokingham Borough Council election
- 2015 Wokingham Borough Council election
- 2016 Wokingham Borough Council election
- 2018 Wokingham Borough Council election
- 2019 Wokingham Borough Council election
- 2021 Wokingham Borough Council election
- 2022 Wokingham Borough Council election
- 2023 Wokingham Borough Council election
Borough result maps
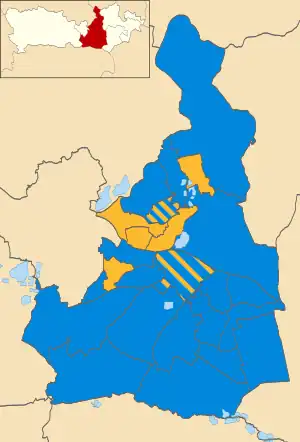 2004 results map
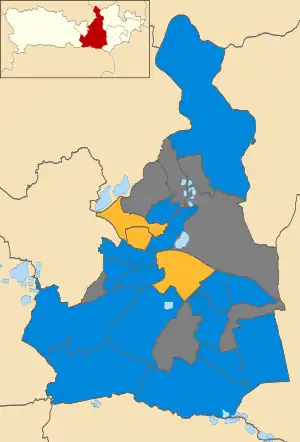 2006 results map
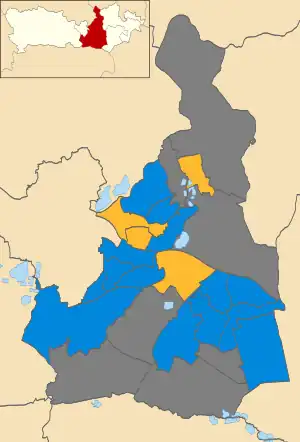 2007 results map
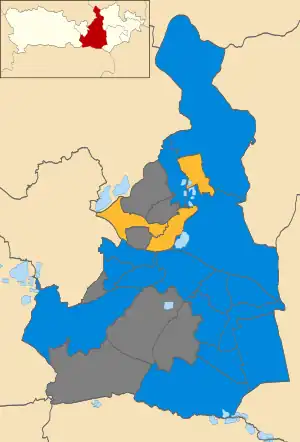 2008 results map
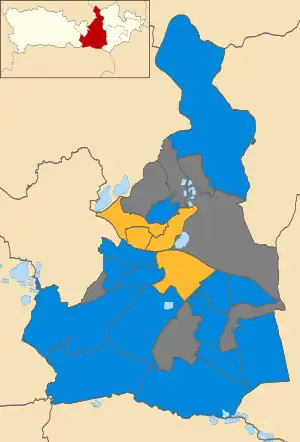 2010 results map
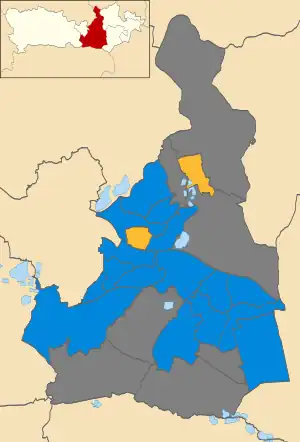 2011 results map
 2012 results map
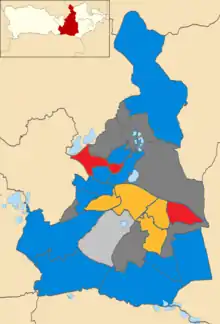 2018 results map
 2019 results map
 2021 results map
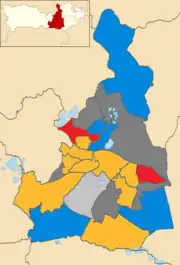 2022 result map
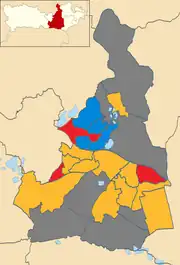 2023 result map
By-election results
1997–2005
| Party | Candidate | Votes | % | ±% | |
|---|---|---|---|---|---|
| Liberal Democrats | 540 | 44.3 | +2.7 | ||
| Labour | 456 | 37.4 | +3.7 | ||
| Conservative | 222 | 18.2 | -6.5 | ||
| Majority | 84 | 6.9 | |||
| Turnout | 1,218 | 39.6 | |||
| Liberal Democrats hold | Swing | ||||
| Party | Candidate | Votes | % | ±% | |
|---|---|---|---|---|---|
| Conservative | 303 | 78.1 | -2.8 | ||
| UKIP | 45 | 11.6 | +11.6 | ||
| Liberal Democrats | 40 | 10.3 | -0.8 | ||
| Majority | 258 | 66.5 | |||
| Turnout | 388 | 22.7 | |||
| Conservative hold | Swing | ||||
| Party | Candidate | Votes | % | ±% | |
|---|---|---|---|---|---|
| Liberal Democrats | Malcolm Armstrong | 751 | 51.5 | +13.1 | |
| Conservative | 622 | 42.6 | +1.0 | ||
| UKIP | 86 | 5.9 | -8.5 | ||
| Majority | 129 | 8.9 | |||
| Turnout | 1,459 | 24.0 | |||
| Liberal Democrats gain from Conservative | Swing | ||||
| Party | Candidate | Votes | % | ±% | |
|---|---|---|---|---|---|
| Conservative | Stuart Munro | 405 | 60.5 | -18.3 | |
| Independent | Max Bowker | 120 | 17.9 | +17.9 | |
| Liberal Democrats | Caroline Smith | 109 | 16.3 | -4.9 | |
| UKIP | Vince Pearson | 35 | 5.2 | +5.2 | |
| Majority | 254 | 42.6 | |||
| Turnout | 669 | ||||
| Conservative hold | Swing | ||||
2005–2009
| Party | Candidate | Votes | % | ±% | |
|---|---|---|---|---|---|
| Conservative | Paul Swaddle | 1,027 | 51.0 | +8.6 | |
| Liberal Democrats | Dave Swindells | 835 | 41.5 | +11.5 | |
| Labour | Jacqueline Rupert | 97 | 4.8 | -5.3 | |
| UKIP | David Lamb | 55 | 2.7 | -8.1 | |
| Majority | 192 | 9.5 | |||
| Turnout | 2,014 | 28.2 | |||
| Conservative hold | Swing | ||||
| Party | Candidate | Votes | % | ±% | |
|---|---|---|---|---|---|
| Conservative | John Kersley | 913 | 70.6 | -2.9 | |
| Liberal Democrats | Martin Alder | 237 | 18.3 | -0.5 | |
| UKIP | Franklin Carstairs | 83 | 6.4 | +2.5 | |
| Labour | Brian Scott | 60 | 4.6 | +0.8 | |
| Majority | 676 | 52.3 | |||
| Turnout | 1,293 | ||||
| Conservative hold | Swing | ||||
| Party | Candidate | Votes | % | ±% | |
|---|---|---|---|---|---|
| Conservative | Katherine Povey | 850 | 53.2 | +0.0 | |
| Liberal Democrats | Coling Lawley | 675 | 42.2 | +4.6 | |
| UKIP | Amy Thornton | 74 | 4.6 | -0.2 | |
| Majority | 175 | 11.0 | |||
| Turnout | 1,599 | ||||
| Conservative hold | Swing | ||||
2009–2013
| Party | Candidate | Votes | % | ±% | |
|---|---|---|---|---|---|
| Conservative | David Sleight | 1,809 | 67.3 | -8.9 | |
| Liberal Democrats | David Vaughan | 711 | 26.5 | +13.0 | |
| BNP | Mark Burke | 166 | 6.2 | +6.2 | |
| Majority | 1,098 | 40.8 | |||
| Turnout | 2,686 | 44.5 | |||
| Conservative hold | Swing | ||||
| Party | Candidate | Votes | % | ±% | |
|---|---|---|---|---|---|
| Conservative | John Halsall | 850 | 65.9 | +0.6 | |
| Liberal Democrats | Martin Alder | 272 | 21.1 | -7.1 | |
| Labour | Matthew Dent | 94 | 7.3 | +0.7 | |
| UKIP | Andy Heape | 55 | 4.3 | +4.3 | |
| Green | Martyn Foss | 19 | 1.5 | +1.5 | |
| Majority | 578 | 44.8 | |||
| Turnout | 1,290 | 29.4 | |||
| Conservative hold | Swing | ||||
2013–present
| Party | Candidate | Votes | % | ±% | |
|---|---|---|---|---|---|
| Liberal Democrats | Imogen Shepherd-DuBey | 1,575 | 59.7 | +22.6 | |
| Conservative | Kevin Morgan | 879 | 33.3 | -4.2 | |
| UKIP | Phil Ray | 104 | 3.9 | -11.5 | |
| Labour | Christopher Everett | 79 | 3.0 | -6.9 | |
| Majority | 696 | 26.4 | |||
| Turnout | 2,637 | 39.7 | –3.4 | ||
| Liberal Democrats gain from Conservative | Swing | ||||
| Party | Candidate | Votes | % | ±% | |
|---|---|---|---|---|---|
| Liberal Democrats | Sarah Kerr | 1,441 | 63.1 | 16.3 | |
| Conservative | Daniel Clawson | 729 | 31.9 | -8.8 | |
| Labour | Timothy Lloyd | 115 | 5 | -7.5 | |
| Majority | 713 | 31 | 35.1 | ||
| Turnout | 2,294 | 32.7 | -8.3 | ||
| Liberal Democrats hold | Swing | ||||
References
- ↑ The District of Wokingham (Electoral Arrangements) Order 1978
- ↑ legislation.gov.uk – The Berkshire, Buckinghamshire, Hampshire, Oxfordshire and Surrey (County Boundaries) Order 1991. Retrieved on 5 November 2015.
- ↑ legislation.gov.uk – The District of Wokingham (Electoral Changes) Order 2002. Retrieved on 4 October 2015.
- ↑ "Wokingham council". BBC News Online. Retrieved 9 January 2010.
- ↑ "Decision making and structure". Wokingham Borough Council. Retrieved 9 January 2010.
- ↑ "Tories inch ahead". guardian.co.uk. London. 9 November 2001. Retrieved 9 January 2010.
- ↑ "Tories suffer triple defeat". guardian.co.uk. London. 26 November 2004. Retrieved 9 January 2010.
- ↑ "Tories claim clean sweep in council byelections". guardian.co.uk. London. 4 November 2005. Retrieved 9 January 2010.
- ↑ "Election results for Remenham, Wargrave and Ruscombe by-election". Wokingham Borough Council. Retrieved 9 January 2010.
- ↑ "Woodley by-election results". Wokingham Borough Council. Retrieved 9 January 2010.
- ↑ "Election results for Wokingham Without Ward by-election 4 June 2009". Wokingham Borough Council. Retrieved 9 January 2010.
- ↑ "Tories seal comfortable by-election victory". Reading Chronicle. 22 July 2011. Retrieved 22 July 2011.
- ↑ "Election results for Emmbrook, 17 February 2017". Wokingham Borough Council. Retrieved 19 February 2017.
- ↑ "Election results for Evendons, 7th February 2017". Wokingham Borough Council. Retrieved 9 February 2019.
External links
| Bracknell Forest Borough Council | |
|---|---|
| Reading Borough Council | |
| Slough Borough Council | |
| West Berkshire Council | |
| Windsor and Maidenhead Borough Council | |
| Wokingham Borough Council | |
| Berkshire County Council |
|
| |

This article is issued from Wikipedia. The text is licensed under Creative Commons - Attribution - Sharealike. Additional terms may apply for the media files.