| Tropical cyclones in 1994 | |
|---|---|
| Year boundaries | |
| First system | 01W (Akang) |
| Formed | January 4, 1994 |
| Last system | Christelle |
| Dissipated | January 11, 1995 |
| Strongest system | |
| Name | Geralda |
| Lowest pressure | 905 mbar (hPa); 26.72 inHg |
| Longest lasting system | |
| Name | John (Second longest-lasting tropical system on record) |
| Duration | 31 days |
| Year statistics | |
| Total systems | 124 |
| Named systems | 91 |
| Total fatalities | 3,733 total |
| Total damage | $11.2 billion (1994 USD) |
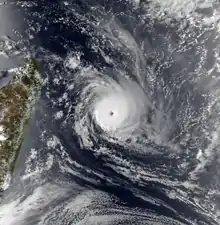
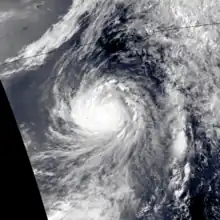
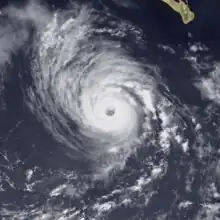
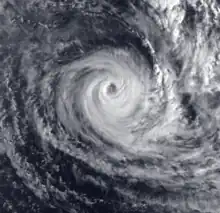
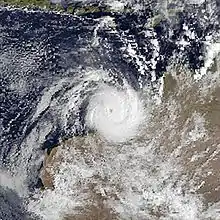
During 1994, tropical cyclones formed within seven different tropical cyclone basins, located within various parts of the Atlantic, Pacific and Indian Oceans. During the year, a total of 124 systems formed with 91 of these developing further and were named by the responsible warning centre. The strongest tropical cyclone of the year was Cyclone Geralda, which was estimated to have a minimum barometric pressure of 905 hPa (26.72 inHg). The deadliest tropical cyclone was Typhoon Fred, which caused 1,248 fatalities in China, while the costliest was Tropical Storm Sharon, which caused an estimated $5.27 billion USD in damage after striking Hong Kong, China and the Philippines. Five Category 5 tropical cyclones formed in 1994. The accumulated cyclone energy (ACE) index for the 1994 (seven basins combined), as calculated by Colorado State University was 1019 units.
Tropical cyclone activity in each basin is under the authority of an RSMC. The National Hurricane Center (NHC) is responsible for tropical cyclones in the North Atlantic and East Pacific. The Central Pacific Hurricane Center (CPHC) is responsible for tropical cyclones in the Central Pacific. Both the NHC and CPHC are subdivisions of the National Weather Service. Activity in the West Pacific is monitored by the Japan Meteorological Agency (JMA). Systems in the North Indian Ocean are monitored by the India Meteorological Department (IMD). The Météo-France located in Réunion (MFR) monitors tropical activity in the South-West Indian Ocean. The Australian region is monitored by five TCWCs that are under the coordination of the Australian Bureau of Meteorology (BOM). Similarly, the South Pacific is monitored by both the Fiji Meteorological Service (FMS) and the Meteorological Service of New Zealand Limited. Other, unofficial agencies that provide additional guidance in tropical cyclone monitoring include the Philippine Atmospheric, Geophysical and Astronomical Services Administration (PAGASA) and the Joint Typhoon Warning Center (JTWC).
Global conditions and hydrological summary
Summary

Systems
January
| Storm name | Dates active | Max wind km/h (mph) |
Pressure (hPa) |
Areas affected | Damage (USD) |
Deaths | Refs |
|---|---|---|---|---|---|---|---|
| 01W (Akang) | January 4–5 | 55 (35) | 1004 | Philippines | $2.4 million | 45 | [1] |
| 07P | January 6–8 | 55 (35) | 1002 | Solomon Islands | None | None | |
| Daisy | January 7–16 | 155 (100) | 935 | St. Brandon, Madagascar | Unknown | Unknown | |
| Pearl-Farah | January 10–21 | 155 (100) | 960 | Western Australia | None | None | |
| Edmea | January 13–19 | 95 (60) | 976 | None | None | None | |
| Sarah | January 22 – February 4 | 165 (105) | 945 | Vanuatu, New Caledonia | Unknown | Unknown | |
| Quenton | January 22–29 | 150 (90) | 955 | None | None | None | |
| Geralda | January 26 – February 8 | 205 (125) | 905 | Madagascar | >$10 million | 231 | [2] |
| Sadie | January 29–31 | 85 (50) | 985 | Northern Territory, Queensland | None | None | |
February
February was an extremely inactive month, featuring only 4 systems, of which all were named. Hollanda was the first storm of the month, peaking as a Category-3 equivalent cyclone and causing strong wind gusts and heavy rainfall on the Mascarene Islands and causing 2 deaths. Ivy and Julita formed afterwards, with Ivy peaking as a Category-3 equivalent cyclone and Julita making landfall on Madagascar. Cyclone Theodore was the last and strongest storm of the month, crossing over into the South Pacific basin and peaking as a Category-4 equivalent cyclone.
| Storm name | Dates active | Max wind km/h (mph) |
Pressure (hPa) |
Areas affected | Damage (USD) |
Deaths | Refs |
|---|---|---|---|---|---|---|---|
| Hollanda | February 6–14 | 155 (100) | 940 | Mauritius, Réunion | $135 million | 2 | [3] |
| Ivy | February 8–20 | 140 (85) | 950 | Rodrigues | Minimal | None | |
| Julita | February 15–18 | 55 (35) | 995 | Madagascar | Minimal | None | |
| Theodore | February 22 – March 3 | 215 (130) | 910 | Papua New Guinea, Solomon Islands, New Caledonia | Unknown | 1 | |
March
| Storm name | Dates active | Max wind km/h (mph) |
Pressure (hPa) |
Areas affected | Damage (USD) |
Deaths | Refs |
|---|---|---|---|---|---|---|---|
| Kelvina | March 5–11 | 85 (50) | 985 | Madagascar, Mascarene Islands | Unknown | 0 | |
| Litanne | March 7–19 | 195 (120) | 910 | Madagascar, Mascarene Islands | Unknown | 0 | |
| Mariola | March 10–19 | 115 (70) | 966 | None | Unknown | 0 | |
| Sharon | March 12–22 | 195 (120) | 930 | Western Australia | None | None | |
| Tomas | March 19–27 | 155 (100) | 955 | Vanuatu, Fiji | Unknown | None | |
| Nadia | March 16 – April 1 | 175 (110) | 925 | Madagascar, Mozambique, Malawi | $20.2 million | 252 | [4][5] |
| BOB 01 | March 21–24 | 45 (30) | Not specified | None | None | None | |
| Usha | March 24 – April 4 | 95 (60) | 980 | Solomon Islands, Vanuatu, New Caledonia | Unknown | None | |
| Tim | March 28 – April 3 | 65 (40) | 995 | None | None | None | |
| Odille | March 30 – April 14 | 175 (110) | 925 | Mascarene Islands | Unknown | 0 | |
| Owen (Bising) | March 31 – April 9 | 110 (70) | 980 | Caroline Islands, Philippines | Unknown | 10 | [6] |
April
| Storm name | Dates active | Max wind km/h (mph) |
Pressure (hPa) |
Areas affected | Damage (USD) |
Deaths | Refs |
|---|---|---|---|---|---|---|---|
| Vivienne | April 5–13 | 150 (90) | 955 | None | None | None | |
| 29P | April 24–25 | 55 (35) | 1000 | Solomon Islands | None | None | |
| Willy | April 26 – May 1 | 95 (60) | 985 | Cocos Islands | None | None | |
| BOB 02 | April 26 – May 3 | 215 (130) | 940 | Bangladesh, Northeast India, Myanmar | $125 million | 350 | [6][7][8][9][10][11] |
May
May was the least active month of 1994, featuring only 3 systems, of which only 1 was named. Typhoon Page, the first and strongest storm of the month, formed on May 12 and stayed out to sea, peaking as a Category-2 equivalent cyclone. Deling formed on May 25, causing 5 deaths in the Philippines. A tropical depression was the last storm of the month.
| Storm name | Dates active | Max wind km/h (mph) |
Pressure (hPa) |
Areas affected | Damage (USD) |
Deaths | Refs |
|---|---|---|---|---|---|---|---|
| Page (Klaring) | May 12–17 | 130 (80) | 965 | Caroline Islands | None | None | |
| 04W (Deling) | May 25–26 | 55 (35) | 1004 | Philippines | None | 5 | [12] |
| TD | May 27 | Not specified | 1004 | None | None | None | |
June
| Storm name | Dates active | Max wind km/h (mph) |
Pressure (hPa) |
Areas affected | Damage (USD) |
Deaths | Refs |
|---|---|---|---|---|---|---|---|
| Russ (Emang) | June 3–9 | 95 (60) | 985 | China | $728 million | 74 | [12] |
| ARB 01 | June 5–9 | 100 (65) | 980 | Western India, Oman | None | None | |
| Aletta | June 18–23 | 85 (50) | 999 | None | None | None | |
| Sharon (Gading) | June 21–25 | 75 (45) | 996 | Philippines, South China | $5.27 billion | 13 | [12] |
| Heling | June 25–29 | Not specified | 1002 | Philippines, Vietnam | None | None | |
| Bud | June 27–29 | 75 (45) | 1003 | None | None | None | |
| Carlotta | June 23 – July 5 | 165 (105) | 967 | Socorro Island, Revillagigedo Islands | None | None | |
| Alberto | June 30 – July 7 | 100 (65) | 993 | Florida Panhandle, Alabama, Georgia | $1.03 billion | 32 | [13][14] |
November
| Storm name | Dates active | Max wind km/h (mph) |
Pressure (hPa) |
Areas affected | Damage (USD) |
Deaths | Refs |
|---|---|---|---|---|---|---|---|
| Florence | November 2–8 | 175 (110) | 972 | None | None | None | |
| Depression | November – | 45 (30) | Not specified | Southern India | None | None | |
| Gordon | November 8–21 | 140 (85) | 980 | Central America, Cayman Islands, Jamaica, Hispaniola, Cuba, Turks and Caicos Islands, Bahamas, Florida, Georgia, Mid-Atlantic states | $594 million | 1152 | [15][16][17][18] |
| Vania | November 10–19 | 100 (65) | 980 | Vanuatu | Minimal | None | |
| ARB 02 | November 15–20 | 120 (75) | 984 | Somalia | Unknown | 30 | [7] |
| Albertine | November 23 – December 3 | 175 (110) | 925 | Mascarene Islands | Unknown | None | |
December
| Storm name | Dates active | Max wind km/h (mph) |
Pressure (hPa) |
Areas affected | Damage (USD) |
Deaths | Refs |
|---|---|---|---|---|---|---|---|
| Annette | December 12–20 | 185 (115) | 925 | Western Australia | Minor | None | |
| 04P | December 13–17 | 65 (40) | 997 | Fiji, Tonga | Unknown | Unknown | |
| Axel (Garding) | December 14–27 | 155 (100) | 950 | Caroline Islands, Philippines | None | 19 | [19] |
| Bobbie | December 18–26 | 95 (60) | 985 | Marshall Islands, Caroline Islands, Mariana Islands | None | None | |
| Christelle | December 27 – January 11 | 85 (50) | 980 | Madagascar, Mascarene Islands | Unknown | None | |
| William | December 30 – January 3 | 110 (70) | 975 | Cook Islands, French Polynesia | $2.5 million | None | |
Global effects
- ↑ The sum of the number of systems and fatalities in each basin will not equal the number shown as the total. This is because when systems move between basins, it creates a discrepancy in the actual number of systems and fatalities.
Notes
2 Only systems that formed either on or after January 1, 1994 are counted in the seasonal totals.
3 Only systems that formed either before or on December 31, 1994 are counted in the seasonal totals.
4 The wind speeds for this tropical cyclone/basin are based on the IMD Scale which uses 3-minute sustained winds.
5 The wind speeds for this tropical cyclone/basin are based on the Saffir Simpson Scale which uses 1-minute sustained winds.
6 The wind speeds for this tropical cyclone/basin are based on Météo-France which uses wind gusts.
References
- ↑ United Nations Department of Humanitarian Affairs (1994-01-13). "Philippines Tropical Storm Akang Jan 1994 UN DHA Information Report 1". ReliefWeb.
- ↑ Guy Le Goff (1994). "1993–1994 Cyclone Season in the South-West Indian Ocean". Météo-France. p. 42. Retrieved 2013-05-05.
- ↑ United Nations Department of Human Affairs (1994). "Mauritius — Cyclones Hollanda/Ivy Feb 1994 UN DHA Situation Reports 1–5". ReliefWeb. Retrieved 2011-10-02.
- ↑ Centre for Research on the Epidemiology of Disasters. "EM-DAT: The Emergency Events Database". Université catholique de Louvain.
- ↑ UN Department of Humanitarian Affairs (1994). Mozambique: Cyclone Mar 1994 UN DHA Situation Reports 1 – 8 (Report). ReliefWeb. Retrieved 2012-08-12.
- 1 2 1994 Annual Tropical Cyclone Report (PDF) (Report). Joint Typhoon Warning Center. Retrieved May 20, 2019.
- 1 2 "Report on cyclonic disturbances over north Indian Ocean during 1994" (PDF). www.rsmcnewdelhi.imd.gov.in. Archived from the original (PDF) on 2020-03-31. Retrieved 2021-03-09.
- ↑ Bangladesh – Cyclone May 1994 UN DHA Information Reports 1–4. United Nations Department of Humanitarian Affairs (Report). May 1994. ReliefWeb. Retrieved May 20, 2019.
- ↑ "21 Bodies of Thai Fishermen Wash Ashore; Cyclone Toll is 285". Associated Press Worldstream. May 10, 1994. – via Lexis Nexis (subscription required)
- ↑ "Thai Survivors Of Cyclone Ready to Sail Home, Toll Up To 308". Associated Press. May 11, 1994. – via Lexis Nexis (subscription required)
- ↑ "Thai survivors of cyclone arrive from Bangladesh". Xinhua. May 16, 1994. – via Lexis Nexis (subscription required)
- 1 2 3 Bill Kyle (1995). "1994 Tropical Cyclone Summary for the Western North Pacific Ocean (west of 180 degrees)" (PDF). University of Hong Kong.
- ↑ "Storm Data – July 1994" (PDF). National Climatic Data Center. Retrieved September 14, 2012.
- ↑ Timothy C. Stamey (1995). Floods In Central And Southeastern Georgia In July 1994 (PDF) (Report). Atlanta, Georgia: Georgia Institute of Technology. Retrieved June 19, 2014.
- ↑ Jamaica National Meteorological Service (1994). "Tropical Storm Gordon Preliminary Damage Assessment". Retrieved 2007-09-09.
- ↑ Université Catholique de Louvain (2007). "EM-DAT: The OFDA/CRED International Disaster Database for North America". Archived from the original on 2007-06-21. Retrieved 2007-09-07.
- ↑ "Storm Data and Unusual Weather Phenomena with Late Reports and Corrections" (PDF). National Climatic Data Center. November 1994. Archived from the original (PDF) on 2021-02-11. Retrieved 2013-04-01.
- ↑ "Heavy rain in Costa Rica leaves 6 dead" (GIF). United Press International. 1994-11-11. Retrieved 2013-04-02.
- ↑ "New storm offers wet Christmas". Manila Standard. December 24, 1994. pp. 1, 3 – via news.google.com.
External links
| Tropical cyclone year articles (1990–1999) |
|---|
| 1990, 1991, 1992, 1993, 1994, 1995, 1996, 1997, 1998, 1999 |
Regional Specialized Meteorological Centers
- US National Hurricane Center – North Atlantic, Eastern Pacific
- Central Pacific Hurricane Center – Central Pacific
- Japan Meteorological Agency – NW Pacific
- India Meteorological Department – Bay of Bengal and the Arabian Sea
- Météo-France – La Reunion – South Indian Ocean from 30°E to 90°E
- Fiji Meteorological Service – South Pacific west of 160°E, north of 25° S
Tropical Cyclone Warning Centers
- Meteorology, Climatology, and Geophysical Agency of Indonesia – South Indian Ocean from 90°E to 141°E, generally north of 10°S
- Australian Bureau of Meteorology (TCWC's Perth, Darwin & Brisbane) – South Indian Ocean & South Pacific Ocean from 90°E to 160°E, generally south of 10°S
- Papua New Guinea National Weather Service – South Pacific Ocean from 141°E to 160°E, generally north of 10°S
- Meteorological Service of New Zealand Limited – South Pacific west of 160°E, south of 25°S
![]() This article incorporates public domain material from websites or documents of the National Weather Service.
This article incorporates public domain material from websites or documents of the National Weather Service.


