| |||||||||||||||||||||||||||||||||
| |||||||||||||||||||||||||||||||||


| |||||||||||||||||||||||||||||||||
| |||||||||||||||||||||||||||||||||
| Elections in Vermont |
|---|
.svg.png.webp) |
The 1996 United States presidential election in Vermont took place on November 7, 1996, as part of the 1996 United States presidential election. Voters chose three representatives, or electors to the Electoral College, who voted for president and vice president.
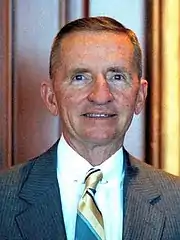
Vermont was won by incumbent Democratic President Bill Clinton over Republican Senator Bob Dole of Kansas, with Clinton winning 53.35% to Dole's 31.09%, a margin of 22.26%. The Reform Party candidate, billionaire businessman Ross Perot, finished in third, with 12.00% of the popular vote.[1]
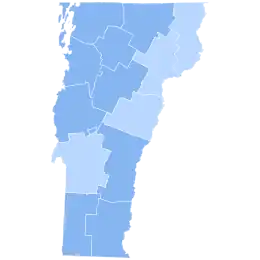
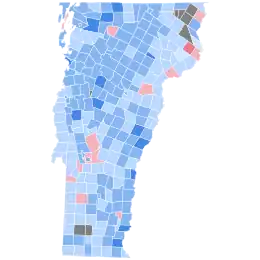
Although Clinton had carried the state comfortably in 1992, prior to that point Vermont had been one of the most reliably Republican states in the nation, voting Republican in every election from 1856 to 1988 except for the 1964 nationwide Democratic landslide. However Vermont had always favored a liberal, secular, Northeastern brand of Republicanism, and by the 1990s, the Republican Party had become increasingly dominated by conservative, Southern, and Evangelical Christian interests. Consequently, Vermont trended increasingly toward the Democratic Party, and Clinton was able to win an even bigger victory in the state in 1996 than he had in 1992, again sweeping every county in the state.
Clinton's win in 1996 marked the first time in history that Vermont had voted Democratic in two consecutive presidential elections, signifying a long-term realignment of the state away from the GOP. It was also the first time since 1964 that a Democratic candidate won a majority of the popular vote (Clinton won the state four years prior, but with only a plurality of 46.11%). Since then Vermont has become regarded as one of the safest of blue states; it has remained Democratic in every election that has followed, often by landslide margins.
Results
| 1996 United States presidential election in Vermont | ||||||
|---|---|---|---|---|---|---|
| Party | Candidate | Running mate | Votes | Percentage | Electoral votes | |
| Democratic | Bill Clinton (incumbent) | Al Gore | 137,894 | 53.35% | 3 | |
| Republican | Robert Dole | Jack Kemp | 80,352 | 31.09% | 0 | |
| Reform | Ross Perot | Patrick Choate | 31,024 | 12.00% | 0 | |
| Green Coalition | Ralph Nader | Anne Goeke[1][lower-alpha 1] | 5,585 | 2.16% | 0 | |
| Libertarian | Harry Browne | Jo Jorgensen | 1,183 | 0.46% | 0 | |
| No party | Write-in | 560 | 0.22% | 0 | ||
| Natural Law | Dr. John Hagelin | Dr. V. Tompkins | 498 | 0.19% | 0 | |
| Grassroots | Dennis Peron | Arlin Troutt Jr. | 480 | 0.19% | 0 | |
| U.S. Taxpayers' Party | Howard Phillips | Albion W. Knight Jr.[1][2] | 382 | 0.15% | 0 | |
| Liberty Union | Mary Cal Hollis | Eric Chester | 292 | 0.11% | 0 | |
| Socialist Workers Party | James Harris | Laura Garza | 199 | 0.08% | 0 | |
Results by county
| County | William Jefferson Clinton[3] Democratic |
Robert Joseph Dole[3] Republican |
Henry Ross Perot[3] Reform |
Ralph Nader[3] Green |
Various candidates[3] Other parties |
Margin | Total votes cast | ||||||
|---|---|---|---|---|---|---|---|---|---|---|---|---|---|
| # | % | # | % | # | % | # | % | # | % | # | % | ||
| Addison | 8,164 | 52.83% | 4,798 | 31.05% | 1,808 | 11.70% | 402 | 2.60% | 281 | 1.82% | 3,366 | 21.78% | 15,453 |
| Bennington | 8,139 | 50.39% | 5,229 | 32.37% | 2,278 | 14.10% | 357 | 2.21% | 149 | 0.92% | 2,910 | 18.02% | 16,152 |
| Caledonia | 5,593 | 47.40% | 4,089 | 34.66% | 1,782 | 15.10% | 201 | 1.70% | 134 | 1.14% | 1,504 | 12.75% | 11,799 |
| Chittenden | 36,299 | 56.84% | 19,020 | 29.78% | 6,180 | 9.68% | 1,395 | 2.18% | 966 | 1.51% | 17,279 | 27.06% | 63,860 |
| Essex | 1,120 | 45.73% | 819 | 33.44% | 442 | 18.05% | 25 | 1.02% | 43 | 1.76% | 301 | 12.29% | 2,449 |
| Franklin | 8,790 | 54.24% | 4,617 | 28.49% | 2,488 | 15.35% | 147 | 0.91% | 164 | 1.01% | 4,173 | 25.75% | 16,206 |
| Grand Isle | 1,555 | 51.13% | 958 | 31.50% | 441 | 14.50% | 45 | 1.48% | 42 | 1.38% | 597 | 19.63% | 3,041 |
| Lamoille | 4,997 | 54.40% | 2,705 | 29.45% | 1,216 | 13.24% | 146 | 1.59% | 122 | 1.33% | 2,292 | 24.95% | 9,186 |
| Orange | 6,107 | 49.79% | 4,043 | 32.96% | 1,597 | 13.02% | 279 | 2.27% | 240 | 1.96% | 2,064 | 16.83% | 12,266 |
| Orleans | 5,137 | 51.44% | 3,114 | 31.18% | 1,508 | 15.10% | 130 | 1.30% | 97 | 0.97% | 2,023 | 20.26% | 9,986 |
| Rutland | 13,230 | 48.59% | 9,934 | 36.48% | 3,408 | 12.52% | 320 | 1.18% | 337 | 1.24% | 3,296 | 12.10% | 27,229 |
| Washington | 14,267 | 55.12% | 7,750 | 29.94% | 2,788 | 10.77% | 739 | 2.86% | 340 | 1.31% | 6,517 | 25.18% | 25,884 |
| Windham | 10,426 | 55.12% | 5,261 | 27.81% | 2,033 | 10.75% | 887 | 4.69% | 308 | 1.63% | 5,165 | 27.31% | 18,915 |
| Windsor | 14,070 | 54.07% | 8,015 | 30.80% | 3,055 | 11.74% | 512 | 1.97% | 371 | 1.43% | 6,055 | 23.27% | 26,023 |
| Totals | 137,894 | 53.35% | 80,352 | 31.09% | 31,024 | 12.00% | 5,585 | 2.16% | 3,594 | 1.39% | 57,542 | 22.26% | 258,449 |
See also
Notes
- ↑ Vermont is one of the states where Ralph Nader's running mate (Winona LaDuke) was replaced on the ballot by Anne Goeke.
References
- 1 2 3 "1996 Presidential General Election Results – Vermont". Dave Leip's U.S. Election Atlas.
- ↑ President Elect - 1996 - http://presidentelect.org/e1996.html Archived 2012-01-14 at the Wayback Machine
- 1 2 3 4 5 Our Campaigns; VT US Presidential Election Race, November 05, 1996


