| |||||||||||||||||||||||||||||||||
| |||||||||||||||||||||||||||||||||
 County and Independent City Results
| |||||||||||||||||||||||||||||||||
| |||||||||||||||||||||||||||||||||


.jpg.webp)
| Elections in Virginia |
|---|
 |
The 1980 United States presidential election in Virginia took place on November 4, 1980. All 50 states and the District of Columbia, were part of the 1980 United States presidential election. Virginia voters chose twelve electors to the Electoral College, which selected the president and vice president of the United States.
Virginia had voted Republican at all but one of the previous seven presidential elections, largely due to its large white Washington and Richmond suburbs that received large-scale in-migration from the Northeast,[1] alongside the Shenandoah Valley,[2] being amongst the first traditionally Democratic areas of the former Confederacy to turn Republican at both the presidential level and in federal congressional elections.[3] After the collapse of the Byrd Organization and the expansion of the state’s formerly small electorate via the Voting Rights Act, these trends intensified except in the heavily unionised coalfields of Southwest Virginia, where unlike elsewhere in the Confederacy, many newly registered poor whites voted Democratic. In addition to voting Republican in six of seven presidential elections, the state’s Congressional delegation would gain a Republican majority as early as the 91st Congress. Nevertheless, it was 1970 before significant GOP gains occurred in the state legislature, and it was generally acknowledged that President Nixon offered no support to down-ballot Republican candidates as he was carrying the state by a landslide margin against George McGovern,[4] who lost every county or city in the state except Charles City.
Campaign
Republican nominee, former California Governor Ronald Reagan and Democratic candidate and incumbent United States President Jimmy Carter of Georgia both campaigned in Virginia during early October.[5] Independent state Senator Harry F. Byrd Jr., who like his father had never previously endorsed a presidential candidate, would endorse Reagan in the middle of October, saying that Carter had a dismal record in controlling federal spending and the Soviet military build-up.[6]
59% of white voters supported Reagan while 33% supported Carter.[7][8]
Predictions
| Source | Ranking | As of |
|---|---|---|
| Kansas City Star[9] | Lean R | October 12, 1980 |
| The Roanoke Times[10] | Likely R | October 26, 1980 |
| Richmond Times-Dispatch[11] | Likely R | October 26, 1980 |
| Daily Press[12] | Likely R | November 3, 1980 |
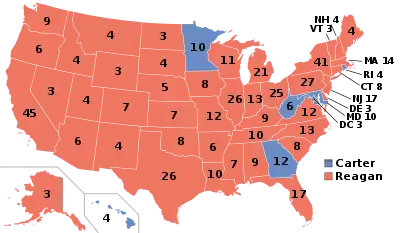
Results
| 1980 United States presidential election in Virginia[13] | |||||
|---|---|---|---|---|---|
| Party | Candidate | Votes | Percentage | Electoral votes | |
| Republican | Ronald Reagan | 989,609 | 53.03% | 12 | |
| Democratic | Jimmy Carter (inc.) | 752,174 | 40.31% | 0 | |
| Independent | John B. Anderson | 95,418 | 5.11% | 0 | |
| Independent | Barry Commoner | 14,024 | 0.75% | 0 | |
| Libertarian | Ed Clark | 12,821 | 0.69% | 0 | |
| Independent | Clifton DeBerry | 1,986 | 0.11% | 0 | |
| Totals | 1,866,032 | 100.00% | 12 | ||
Results by county or independent city
| 1980 United States presidential election in Virginia by county or independent city[14] | |||||||||||||||
|---|---|---|---|---|---|---|---|---|---|---|---|---|---|---|---|
| Ronald Reagan Republican |
Jimmy Carter Democratic |
John B. Anderson Independent |
Barry Commoner Independent |
Edward E. Clark Libertarian |
Clifton DeBerry Independent |
Margin | Total votes cast | ||||||||
| # | % | # | % | # | % | # | % | # | % | # | % | # | % | ||
| Accomack County | 5,371 | 50.21% | 4,872 | 45.54% | 292 | 2.73% | 78 | 0.73% | 73 | 0.68% | 12 | 0.11% | 499 | 4.66% | 10,698 |
| Albemarle County | 10,424 | 53.23% | 7,293 | 37.24% | 1,435 | 7.33% | 140 | 0.71% | 282 | 1.44% | 8 | 0.04% | 3,131 | 15.99% | 19,582 |
| Alleghany County | 2,185 | 45.94% | 2,411 | 50.69% | 116 | 2.44% | 16 | 0.34% | 26 | 0.55% | 2 | 0.04% | -226 | -4.75% | 4,756 |
| Amelia County | 1,969 | 53.20% | 1,643 | 44.39% | 52 | 1.41% | 8 | 0.22% | 23 | 0.62% | 6 | 0.16% | 326 | 8.81% | 3,701 |
| Amherst County | 5,088 | 57.56% | 3,476 | 39.32% | 208 | 2.35% | 20 | 0.23% | 45 | 0.51% | 3 | 0.03% | 1,612 | 18.24% | 8,840 |
| Appomattox County | 2,548 | 60.42% | 1,492 | 35.38% | 85 | 2.02% | 64 | 1.52% | 23 | 0.55% | 5 | 0.12% | 1,056 | 25.04% | 4,217 |
| Arlington County | 30,854 | 46.15% | 26,502 | 39.64% | 8,042 | 12.03% | 652 | 0.98% | 744 | 1.11% | 67 | 0.10% | 4,352 | 6.51% | 66,861 |
| Augusta County | 11,011 | 64.32% | 5,202 | 30.39% | 539 | 3.15% | 254 | 1.48% | 100 | 0.58% | 14 | 0.08% | 5,809 | 33.93% | 17,120 |
| Bath County | 921 | 45.89% | 999 | 49.78% | 70 | 3.49% | 1 | 0.05% | 16 | 0.80% | 0 | 0.00% | -78 | -3.89% | 2,007 |
| Bedford County | 6,608 | 55.81% | 4,721 | 39.87% | 336 | 2.84% | 90 | 0.76% | 66 | 0.56% | 19 | 0.16% | 1,887 | 15.94% | 11,840 |
| Bland County | 1,278 | 54.50% | 1,002 | 42.73% | 35 | 1.49% | 16 | 0.68% | 11 | 0.47% | 3 | 0.13% | 276 | 11.77% | 2,345 |
| Botetourt County | 4,408 | 51.24% | 3,698 | 42.99% | 329 | 3.82% | 86 | 1.00% | 71 | 0.83% | 10 | 0.12% | 710 | 8.25% | 8,602 |
| Brunswick County | 2,310 | 39.39% | 3,430 | 58.49% | 70 | 1.19% | 22 | 0.38% | 26 | 0.44% | 6 | 0.10% | -1,120 | -19.10% | 5,864 |
| Buchanan County | 4,554 | 42.85% | 5,768 | 54.27% | 95 | 0.89% | 167 | 1.57% | 37 | 0.35% | 8 | 0.08% | -1,214 | -11.42% | 10,629 |
| Buckingham County | 1,864 | 47.51% | 1,933 | 49.27% | 77 | 1.96% | 22 | 0.56% | 20 | 0.51% | 7 | 0.18% | -69 | -1.76% | 3,923 |
| Campbell County | 9,592 | 65.16% | 4,473 | 30.39% | 396 | 2.69% | 167 | 1.13% | 75 | 0.51% | 18 | 0.12% | 5,119 | 34.77% | 14,721 |
| Caroline County | 2,071 | 40.18% | 2,924 | 56.73% | 116 | 2.25% | 15 | 0.29% | 27 | 0.52% | 1 | 0.02% | -853 | -16.55% | 5,154 |
| Carroll County | 5,905 | 61.29% | 3,437 | 35.68% | 183 | 1.90% | 37 | 0.38% | 63 | 0.65% | 9 | 0.09% | 2,468 | 25.62% | 9,634 |
| Charles City County | 506 | 23.74% | 1,564 | 73.39% | 39 | 1.83% | 7 | 0.33% | 10 | 0.47% | 5 | 0.23% | -1,058 | -49.65% | 2,131 |
| Charlotte County | 2,322 | 51.26% | 2,108 | 46.53% | 59 | 1.30% | 25 | 0.55% | 8 | 0.18% | 8 | 0.18% | 214 | 4.72% | 4,530 |
| Chesterfield County | 37,908 | 70.71% | 13,060 | 24.36% | 2,182 | 4.07% | 93 | 0.17% | 353 | 0.66% | 17 | 0.03% | 24,848 | 46.35% | 53,613 |
| Clarke County | 1,876 | 57.44% | 1,156 | 35.39% | 177 | 5.42% | 14 | 0.43% | 40 | 1.22% | 3 | 0.09% | 720 | 22.05% | 3,266 |
| Craig County | 768 | 43.17% | 946 | 53.18% | 41 | 2.30% | 5 | 0.28% | 18 | 1.01% | 1 | 0.06% | -178 | -10.01% | 1,779 |
| Culpeper County | 4,312 | 59.43% | 2,519 | 34.72% | 231 | 3.18% | 127 | 1.75% | 55 | 0.76% | 11 | 0.15% | 1,793 | 24.71% | 7,255 |
| Cumberland County | 1,515 | 50.10% | 1,355 | 44.81% | 51 | 1.69% | 74 | 2.45% | 19 | 0.63% | 10 | 0.33% | 160 | 5.29% | 3,024 |
| Dickenson County | 3,687 | 46.12% | 4,177 | 52.25% | 77 | 0.96% | 16 | 0.20% | 31 | 0.39% | 7 | 0.09% | -490 | -6.13% | 7,995 |
| Dinwiddie County | 3,369 | 48.01% | 3,475 | 49.52% | 107 | 1.52% | 27 | 0.38% | 30 | 0.43% | 10 | 0.14% | -106 | -1.51% | 7,018 |
| Essex County | 1,581 | 52.93% | 1,280 | 42.85% | 76 | 2.54% | 26 | 0.87% | 20 | 0.67% | 4 | 0.13% | 301 | 10.08% | 2,987 |
| Fairfax County | 137,620 | 57.41% | 73,734 | 30.76% | 24,605 | 10.26% | 1,557 | 0.65% | 1,933 | 0.81% | 256 | 0.11% | 63,886 | 26.65% | 239,705 |
| Fauquier County | 6,782 | 58.11% | 4,119 | 35.30% | 548 | 4.70% | 113 | 0.97% | 93 | 0.80% | 15 | 0.13% | 2,663 | 22.82% | 11,670 |
| Floyd County | 2,447 | 56.60% | 1,642 | 37.98% | 131 | 3.03% | 59 | 1.36% | 42 | 0.97% | 2 | 0.05% | 805 | 18.62% | 4,323 |
| Fluvanna County | 1,605 | 50.41% | 1,424 | 44.72% | 108 | 3.39% | 17 | 0.53% | 28 | 0.88% | 2 | 0.06% | 181 | 5.68% | 3,184 |
| Franklin County | 4,993 | 45.02% | 5,685 | 51.26% | 304 | 2.74% | 40 | 0.36% | 63 | 0.57% | 5 | 0.05% | -692 | -6.24% | 11,090 |
| Frederick County | 7,293 | 67.61% | 2,948 | 27.33% | 455 | 4.22% | 26 | 0.24% | 62 | 0.57% | 3 | 0.03% | 4,345 | 40.28% | 10,787 |
| Giles County | 2,978 | 42.91% | 3,627 | 52.26% | 211 | 3.04% | 54 | 0.78% | 63 | 0.91% | 7 | 0.10% | -649 | -9.35% | 6,940 |
| Gloucester County | 4,261 | 53.96% | 3,138 | 39.74% | 354 | 4.48% | 76 | 0.96% | 56 | 0.71% | 12 | 0.15% | 1,123 | 14.22% | 7,897 |
| Goochland County | 2,423 | 49.68% | 2,290 | 46.96% | 113 | 2.32% | 11 | 0.23% | 32 | 0.66% | 8 | 0.16% | 133 | 2.73% | 4,877 |
| Grayson County | 3,494 | 53.37% | 2,875 | 43.91% | 106 | 1.62% | 26 | 0.40% | 39 | 0.60% | 7 | 0.11% | 619 | 9.45% | 6,547 |
| Greene County | 1,702 | 60.55% | 925 | 32.91% | 105 | 3.74% | 47 | 1.67% | 22 | 0.78% | 10 | 0.36% | 777 | 27.64% | 2,811 |
| Greensville County | 1,583 | 41.66% | 2,142 | 56.37% | 39 | 1.03% | 18 | 0.47% | 12 | 0.32% | 6 | 0.16% | -559 | -14.71% | 3,800 |
| Halifax County | 5,088 | 51.73% | 4,528 | 46.03% | 125 | 1.27% | 57 | 0.58% | 30 | 0.31% | 8 | 0.08% | 560 | 5.69% | 9,836 |
| Hanover County | 14,262 | 70.02% | 5,383 | 26.43% | 589 | 2.89% | 32 | 0.16% | 99 | 0.49% | 3 | 0.01% | 8,879 | 43.59% | 20,368 |
| Henrico County | 50,505 | 66.85% | 21,023 | 27.83% | 2,956 | 3.91% | 595 | 0.79% | 422 | 0.56% | 50 | 0.07% | 29,482 | 39.02% | 75,551 |
| Henry County | 8,258 | 46.44% | 8,800 | 49.49% | 355 | 2.00% | 247 | 1.39% | 103 | 0.58% | 20 | 0.11% | -542 | -3.05% | 17,783 |
| Highland County | 751 | 58.76% | 487 | 38.11% | 25 | 1.96% | 10 | 0.78% | 5 | 0.39% | 0 | 0.00% | 264 | 20.66% | 1,278 |
| Isle of Wight County | 3,526 | 45.30% | 3,951 | 50.76% | 197 | 2.53% | 35 | 0.45% | 64 | 0.82% | 11 | 0.14% | -425 | -5.46% | 7,784 |
| James City County | 4,289 | 53.29% | 3,068 | 38.12% | 551 | 6.85% | 71 | 0.88% | 55 | 0.68% | 14 | 0.17% | 1,221 | 15.17% | 8,048 |
| King and Queen County | 949 | 44.14% | 1,128 | 52.47% | 43 | 2.00% | 5 | 0.23% | 21 | 0.98% | 4 | 0.19% | -179 | -8.33% | 2,150 |
| King George County | 1,784 | 53.54% | 1,318 | 39.56% | 185 | 5.55% | 7 | 0.21% | 35 | 1.05% | 3 | 0.09% | 466 | 13.99% | 3,332 |
| King William County | 2,036 | 56.54% | 1,446 | 40.16% | 80 | 2.22% | 14 | 0.39% | 24 | 0.67% | 1 | 0.03% | 590 | 16.38% | 3,601 |
| Lancaster County | 2,780 | 61.01% | 1,567 | 34.39% | 106 | 2.33% | 69 | 1.51% | 24 | 0.53% | 11 | 0.24% | 1,213 | 26.62% | 4,557 |
| Lee County | 4,417 | 47.10% | 4,758 | 50.74% | 137 | 1.46% | 28 | 0.30% | 33 | 0.35% | 4 | 0.04% | -341 | -3.64% | 9,377 |
| Loudoun County | 12,076 | 58.93% | 6,694 | 32.67% | 1,312 | 6.40% | 201 | 0.98% | 166 | 0.81% | 43 | 0.21% | 5,382 | 26.26% | 20,492 |
| Louisa County | 2,633 | 46.14% | 2,809 | 49.23% | 160 | 2.80% | 38 | 0.67% | 58 | 1.02% | 8 | 0.14% | -176 | -3.08% | 5,706 |
| Lunenburg County | 2,045 | 49.44% | 1,958 | 47.34% | 59 | 1.43% | 55 | 1.33% | 8 | 0.19% | 11 | 0.27% | 87 | 2.10% | 4,136 |
| Madison County | 1,959 | 55.64% | 1,351 | 38.37% | 156 | 4.43% | 27 | 0.77% | 27 | 0.77% | 1 | 0.03% | 608 | 17.27% | 3,521 |
| Mathews County | 2,204 | 59.31% | 1,300 | 34.98% | 148 | 3.98% | 37 | 1.00% | 19 | 0.51% | 8 | 0.22% | 904 | 24.33% | 3,716 |
| Mecklenburg County | 4,853 | 54.45% | 3,790 | 42.52% | 142 | 1.59% | 81 | 0.91% | 32 | 0.36% | 15 | 0.17% | 1,063 | 11.93% | 8,913 |
| Middlesex County | 1,810 | 54.13% | 1,395 | 41.72% | 90 | 2.69% | 25 | 0.75% | 15 | 0.45% | 9 | 0.27% | 415 | 12.41% | 3,344 |
| Montgomery County | 8,222 | 47.41% | 7,455 | 42.98% | 1,400 | 8.07% | 93 | 0.54% | 161 | 0.93% | 13 | 0.07% | 767 | 4.42% | 17,344 |
| Nelson County | 1,866 | 41.50% | 2,410 | 53.60% | 143 | 3.18% | 35 | 0.78% | 41 | 0.91% | 1 | 0.02% | -544 | -12.10% | 4,496 |
| New Kent County | 1,739 | 57.30% | 1,204 | 39.67% | 68 | 2.24% | 9 | 0.30% | 15 | 0.49% | 0 | 0.00% | 535 | 17.63% | 3,035 |
| Northampton County | 2,165 | 45.65% | 2,363 | 49.82% | 114 | 2.40% | 53 | 1.12% | 34 | 0.72% | 14 | 0.30% | -198 | -4.17% | 4,743 |
| Northumberland County | 2,598 | 60.00% | 1,551 | 35.82% | 109 | 2.52% | 42 | 0.97% | 20 | 0.46% | 10 | 0.23% | 1,047 | 24.18% | 4,330 |
| Nottoway County | 2,813 | 50.13% | 2,593 | 46.21% | 113 | 2.01% | 63 | 1.12% | 22 | 0.39% | 7 | 0.12% | 220 | 3.92% | 5,611 |
| Orange County | 3,381 | 54.90% | 2,420 | 39.30% | 241 | 3.91% | 54 | 0.88% | 58 | 0.94% | 4 | 0.06% | 961 | 15.61% | 6,158 |
| Page County | 4,297 | 60.20% | 2,607 | 36.52% | 161 | 2.26% | 27 | 0.38% | 41 | 0.57% | 5 | 0.07% | 1,690 | 23.68% | 7,138 |
| Patrick County | 3,436 | 56.12% | 2,382 | 38.90% | 105 | 1.71% | 154 | 2.52% | 35 | 0.57% | 11 | 0.18% | 1,054 | 17.21% | 6,123 |
| Pittsylvania County | 12,022 | 59.28% | 7,653 | 37.74% | 250 | 1.23% | 275 | 1.36% | 54 | 0.27% | 26 | 0.13% | 4,369 | 21.54% | 20,280 |
| Powhatan County | 2,933 | 64.18% | 1,484 | 32.47% | 98 | 2.14% | 9 | 0.20% | 39 | 0.85% | 7 | 0.15% | 1,449 | 31.71% | 4,570 |
| Prince Edward County | 2,774 | 49.55% | 2,553 | 45.61% | 137 | 2.45% | 82 | 1.46% | 41 | 0.73% | 11 | 0.20% | 221 | 3.95% | 5,598 |
| Prince George County | 3,389 | 57.56% | 2,310 | 39.23% | 130 | 2.21% | 12 | 0.20% | 40 | 0.68% | 7 | 0.12% | 1,079 | 18.33% | 5,888 |
| Prince William County | 23,061 | 58.95% | 12,787 | 32.69% | 2,676 | 6.84% | 226 | 0.58% | 313 | 0.80% | 56 | 0.14% | 10,274 | 26.26% | 39,119 |
| Pulaski County | 5,747 | 47.73% | 5,769 | 47.92% | 343 | 2.85% | 92 | 0.76% | 81 | 0.67% | 8 | 0.07% | -22 | -0.18% | 12,040 |
| Rappahannock County | 1,179 | 49.81% | 1,055 | 44.57% | 99 | 4.18% | 11 | 0.46% | 21 | 0.89% | 2 | 0.08% | 124 | 5.24% | 2,367 |
| Richmond County | 1,567 | 62.81% | 854 | 34.23% | 49 | 1.96% | 8 | 0.32% | 14 | 0.56% | 3 | 0.12% | 713 | 28.58% | 2,495 |
| Roanoke County | 17,182 | 55.76% | 12,114 | 39.31% | 1,286 | 4.17% | 45 | 0.15% | 180 | 0.58% | 7 | 0.02% | 5,068 | 16.45% | 30,814 |
| Rockbridge County | 2,784 | 49.04% | 2,475 | 43.60% | 296 | 5.21% | 62 | 1.09% | 54 | 0.95% | 6 | 0.11% | 309 | 5.44% | 5,677 |
| Rockingham County | 11,397 | 63.82% | 5,294 | 29.64% | 771 | 4.32% | 233 | 1.30% | 143 | 0.80% | 21 | 0.12% | 6,103 | 34.17% | 17,859 |
| Russell County | 4,778 | 43.94% | 5,764 | 53.01% | 125 | 1.15% | 159 | 1.46% | 38 | 0.35% | 10 | 0.09% | -986 | -9.07% | 10,874 |
| Scott County | 4,744 | 50.54% | 4,314 | 45.96% | 153 | 1.63% | 145 | 1.54% | 27 | 0.29% | 4 | 0.04% | 430 | 4.58% | 9,387 |
| Shenandoah County | 7,517 | 67.10% | 3,137 | 28.00% | 385 | 3.44% | 59 | 0.53% | 95 | 0.85% | 10 | 0.09% | 4,380 | 39.10% | 11,203 |
| Smyth County | 6,033 | 50.86% | 5,335 | 44.98% | 224 | 1.89% | 190 | 1.60% | 64 | 0.54% | 15 | 0.13% | 698 | 5.88% | 11,861 |
| Southampton County | 2,997 | 45.50% | 3,347 | 50.81% | 163 | 2.47% | 24 | 0.36% | 49 | 0.74% | 7 | 0.11% | -350 | -5.31% | 6,587 |
| Spotsylvania County | 5,385 | 53.82% | 4,039 | 40.37% | 464 | 4.64% | 29 | 0.29% | 72 | 0.72% | 16 | 0.16% | 1,346 | 13.45% | 10,005 |
| Stafford County | 7,106 | 58.85% | 4,211 | 34.87% | 623 | 5.16% | 28 | 0.23% | 100 | 0.83% | 7 | 0.06% | 2,895 | 23.98% | 12,075 |
| Surry County | 962 | 34.10% | 1,756 | 62.25% | 63 | 2.23% | 9 | 0.32% | 24 | 0.85% | 7 | 0.25% | -794 | -28.15% | 2,821 |
| Sussex County | 1,664 | 38.94% | 2,447 | 57.27% | 86 | 2.01% | 31 | 0.73% | 26 | 0.61% | 19 | 0.44% | -783 | -18.32% | 4,273 |
| Tazewell County | 7,021 | 48.67% | 7,003 | 48.55% | 225 | 1.56% | 110 | 0.76% | 61 | 0.42% | 5 | 0.03% | 18 | 0.12% | 14,425 |
| Warren County | 3,861 | 55.79% | 2,597 | 37.53% | 297 | 4.29% | 104 | 1.50% | 46 | 0.66% | 15 | 0.22% | 1,264 | 18.27% | 6,920 |
| Washington County | 8,402 | 53.87% | 6,390 | 40.97% | 382 | 2.45% | 320 | 2.05% | 79 | 0.51% | 24 | 0.15% | 2,012 | 12.90% | 15,597 |
| Westmoreland County | 2,510 | 50.31% | 2,271 | 45.52% | 133 | 2.67% | 44 | 0.88% | 24 | 0.48% | 7 | 0.14% | 239 | 4.79% | 4,989 |
| Wise County | 5,767 | 43.89% | 6,779 | 51.59% | 258 | 1.96% | 267 | 2.03% | 50 | 0.38% | 20 | 0.15% | -1,012 | -7.70% | 13,141 |
| Wythe County | 4,758 | 54.28% | 3,677 | 41.95% | 164 | 1.87% | 95 | 1.08% | 61 | 0.70% | 11 | 0.13% | 1,081 | 12.33% | 8,766 |
| York County | 6,744 | 55.58% | 4,532 | 37.35% | 723 | 5.96% | 36 | 0.30% | 95 | 0.78% | 3 | 0.02% | 2,212 | 18.23% | 12,133 |
| Alexandria City | 17,865 | 44.23% | 17,134 | 42.42% | 4,546 | 11.26% | 458 | 1.13% | 326 | 0.81% | 59 | 0.15% | 731 | 1.81% | 40,388 |
| Bedford City | 1,145 | 47.26% | 1,149 | 47.42% | 75 | 3.10% | 32 | 1.32% | 20 | 0.83% | 2 | 0.08% | -4 | -0.17% | 2,423 |
| Bristol City | 3,432 | 52.68% | 2,889 | 44.34% | 160 | 2.46% | 3 | 0.05% | 31 | 0.48% | 0 | 0.00% | 543 | 8.33% | 6,515 |
| Buena Vista City | 942 | 45.09% | 1,031 | 49.35% | 59 | 2.82% | 38 | 1.82% | 12 | 0.57% | 7 | 0.34% | -89 | -4.26% | 2,089 |
| Charlottesville City | 5,907 | 40.56% | 6,866 | 47.15% | 1,377 | 9.46% | 25 | 0.55% | 8 | 0.18% | 8 | 0.18% | -959 | -6.59% | 14,562 |
| Chesapeake City | 17,888 | 48.47% | 17,155 | 46.49% | 1,189 | 3.22% | 245 | 1.68% | 148 | 1.02% | 19 | 0.13% | 733 | 1.99% | 36,904 |
| Clifton Forge City | 716 | 39.23% | 1,012 | 55.45% | 68 | 3.73% | 388 | 1.05% | 216 | 0.59% | 68 | 0.18% | -296 | -16.22% | 1,825 |
| Colonial Heights City | 5,012 | 70.96% | 1,692 | 23.96% | 219 | 3.10% | 21 | 1.15% | 6 | 0.33% | 2 | 0.11% | 3,320 | 47.01% | 7,063 |
| Covington City | 1,187 | 37.68% | 1,813 | 57.56% | 101 | 3.21% | 99 | 1.40% | 38 | 0.54% | 3 | 0.04% | -626 | -19.87% | 3,150 |
| Danville City | 10,665 | 61.43% | 6,138 | 35.35% | 296 | 1.70% | 198 | 1.14% | 56 | 0.32% | 9 | 0.05% | 4,527 | 26.07% | 17,362 |
| Emporia City | 988 | 51.95% | 855 | 44.95% | 41 | 2.16% | 7 | 0.37% | 8 | 0.42% | 3 | 0.16% | 133 | 6.99% | 1,902 |
| Fairfax City | 4,475 | 55.91% | 2,614 | 32.66% | 800 | 10.00% | 42 | 0.52% | 65 | 0.81% | 8 | 0.10% | 1,861 | 23.25% | 8,004 |
| Falls Church City | 2,485 | 52.23% | 1,703 | 35.79% | 497 | 10.45% | 113 | 0.97% | 93 | 0.80% | 15 | 0.13% | 782 | 16.44% | 4,758 |
| Franklin City | 1,045 | 42.55% | 1,324 | 53.91% | 62 | 2.52% | 5 | 0.20% | 15 | 0.61% | 5 | 0.20% | -279 | -11.36% | 2,456 |
| Fredericksburg City | 2,502 | 50.36% | 2,174 | 43.76% | 245 | 4.93% | 9 | 0.18% | 34 | 0.68% | 4 | 0.08% | 328 | 6.60% | 4,968 |
| Galax City | 1,188 | 51.81% | 1,061 | 46.27% | 31 | 1.35% | 3 | 0.13% | 6 | 0.26% | 4 | 0.17% | 127 | 5.54% | 2,293 |
| Hampton City | 17,023 | 45.08% | 18,517 | 49.03% | 1,598 | 4.23% | 329 | 0.87% | 234 | 0.62% | 64 | 0.17% | -1,494 | -3.96% | 37,765 |
| Harrisonburg City | 3,388 | 58.45% | 1,896 | 32.71% | 403 | 6.95% | 61 | 1.05% | 39 | 0.67% | 9 | 0.16% | 1,492 | 25.74% | 5,796 |
| Hopewell City | 4,423 | 56.19% | 3,102 | 39.41% | 178 | 2.26% | 97 | 1.23% | 57 | 0.72% | 15 | 0.19% | 1,321 | 16.78% | 7,872 |
| Lexington City | 956 | 45.90% | 963 | 46.23% | 129 | 6.19% | 16 | 0.77% | 19 | 0.91% | 0 | 0.00% | -7 | -0.34% | 2,083 |
| Lynchburg City | 15,245 | 62.44% | 7,783 | 31.88% | 854 | 3.50% | 373 | 1.53% | 128 | 0.52% | 34 | 0.14% | 7,462 | 30.56% | 24,417 |
| Manassas City | 3,009 | 60.76% | 1,565 | 31.60% | 318 | 6.42% | 23 | 0.46% | 31 | 0.63% | 6 | 0.12% | 1,444 | 29.16% | 4,952 |
| Manassas Park City | 729 | 58.13% | 447 | 35.65% | 52 | 4.15% | 7 | 0.56% | 19 | 1.52% | 0 | 0.00% | 282 | 22.49% | 1,254 |
| Martinsville City | 3,433 | 48.82% | 3,337 | 47.45% | 162 | 2.30% | 70 | 1.00% | 22 | 0.31% | 8 | 0.11% | 96 | 1.37% | 7,032 |
| Newport News City | 22,423 | 47.73% | 22,066 | 46.97% | 2,068 | 4.40% | 114 | 0.24% | 268 | 0.57% | 43 | 0.09% | 357 | 0.76% | 46,982 |
| Norfolk City | 27,506 | 40.93% | 35,118 | 52.26% | 3,333 | 4.96% | 623 | 0.93% | 488 | 0.73% | 132 | 0.20% | -7,612 | -11.33% | 67,200 |
| Norton City | 572 | 40.86% | 762 | 54.43% | 42 | 3.00% | 12 | 0.86% | 11 | 0.79% | 1 | 0.07% | -190 | -13.57% | 1,400 |
| Petersburg City | 5,001 | 37.67% | 7,931 | 59.73% | 254 | 1.91% | 21 | 0.16% | 63 | 0.47% | 7 | 0.05% | -2,930 | -22.07% | 13,277 |
| Poquoson City | 2,338 | 68.78% | 877 | 25.80% | 158 | 4.65% | 5 | 0.15% | 21 | 0.62% | 0 | 0.00% | 1,461 | 42.98% | 3,399 |
| Portsmouth City | 13,660 | 38.00% | 20,900 | 58.14% | 1,124 | 3.13% | 79 | 0.22% | 171 | 0.48% | 15 | 0.04% | -7,240 | -20.14% | 35,949 |
| Radford City | 1,964 | 44.01% | 2,225 | 49.85% | 233 | 5.22% | 18 | 0.40% | 21 | 0.47% | 2 | 0.04% | -261 | -5.85% | 4,463 |
| Richmond City | 34,629 | 39.76% | 47,975 | 55.08% | 3,502 | 4.02% | 330 | 0.38% | 625 | 0.72% | 45 | 0.05% | -13,346 | -15.32% | 87,106 |
| Roanoke City | 15,164 | 43.39% | 18,139 | 51.91% | 1,350 | 3.86% | 75 | 0.21% | 207 | 0.59% | 11 | 0.03% | -2,975 | -8.51% | 34,946 |
| Salem City | 4,862 | 51.78% | 4,091 | 43.57% | 359 | 3.82% | 17 | 0.18% | 50 | 0.53% | 10 | 0.11% | 771 | 8.21% | 9,389 |
| South Boston City | 1,615 | 60.97% | 971 | 36.66% | 51 | 1.93% | 5 | 0.19% | 6 | 0.23% | 1 | 0.04% | 644 | 24.31% | 2,649 |
| Staunton City | 4,819 | 60.79% | 2,658 | 33.53% | 311 | 3.92% | 89 | 1.12% | 42 | 0.53% | 8 | 0.10% | 2,161 | 27.26% | 7,927 |
| Suffolk City | 7,179 | 42.82% | 9,064 | 54.07% | 360 | 2.15% | 56 | 0.33% | 98 | 0.58% | 8 | 0.05% | -1,885 | -11.24% | 16,765 |
| Virginia Beach City | 47,936 | 60.50% | 24,895 | 31.42% | 4,830 | 6.10% | 690 | 0.87% | 764 | 0.96% | 120 | 0.15% | 23,041 | 29.08% | 79,235 |
| Waynesboro City | 3,697 | 61.84% | 1,926 | 32.22% | 255 | 4.27% | 72 | 1.20% | 23 | 0.38% | 5 | 0.08% | 1,771 | 29.63% | 5,978 |
| Williamsburg City | 1,344 | 45.51% | 1,199 | 40.60% | 340 | 11.51% | 41 | 1.39% | 26 | 0.88% | 3 | 0.10% | 145 | 4.91% | 2,953 |
| Winchester City | 4,240 | 64.02% | 2,006 | 30.29% | 320 | 4.83% | 18 | 0.27% | 34 | 0.51% | 5 | 0.08% | 2,234 | 33.73% | 6,623 |
| Totals | 989,609 | 53.03% | 752,174 | 40.31% | 95,418 | 5.11% | 14,024 | 0.75% | 12,821 | 0.69% | 1,986 | 0.11% | 237,435 | 12.72% | 1,866,032 |
Results by congressional district
Reagan won 9 of 10 congressional districts. The only district Carter won was held by a Republican, whilst Reagan won three districts held by Democrats, two of whom lost re-election.[15]
| District | Reagan | Carter | Representative |
|---|---|---|---|
| 1st | 50% | 44% | Paul Trible (R) |
| 2nd | 51% | 41% | G. William Whitehurst (R) |
| 3rd | 55% | 40% | Thomas J. Bliley Jr. (R) |
| 4th | 46% | 50% | Robert W. Daniel jr. (R) |
| 5th | 56% | 40% | Dan Daniel (D) |
| 6th | 53% | 42% | M. Caldwell Butler (R) |
| 7th | 57% | 36% | J. Kenneth Robinson (R) |
| 8th | 56% | 33% | Herbert E. Harris (D) |
| Stanford Parris (R) | |||
| 9th | 49% | 47% | Will Wampler (R) |
| 10th | 54% | 34% | Joseph L. Fisher (D) |
| Frank R. Wolf (R) |
Analysis
Virginia was ultimately won by Reagan with a substantially larger majority than predicted by the Roanoke Times a week before the poll. Reagan received 53.03 percent of the vote to Carter’s 40.31 percent and Independent Representative John B. Anderson of Illinois’s 5.11 percent, which was still Anderson’s second-best performance in a former Confederate state.[16] The national election was ultimately won by Reagan with 50.75 percent of the vote.[17] In this election, Virginia voted 2.98 points to the right of the nation at-large.
As of the 2020 presidential election, this is the last occasion when Franklin County, Isle of Wight County, Craig County, Louisa County and Pulaski County have voted for a Democratic presidential candidate. It is also the last time Arlington County and Alexandria City have voted for a Republican presidential candidate,[18] the last occasion Virginia voted to the right of South Carolina, and the last election when Virginia voted to the left of Colorado until 2016 or New Mexico.
References
- ↑ Heinemann, Ronald L. (2008). Old Dominion, New Commonwealth: A History of Virginia, 1607-2007. Charlottesville: University of Virginia Press. p. 357. ISBN 0813927692.
- ↑ Phillips, Kevin P. (1969). The Emerging Republican Majority. pp. 260–266. ISBN 0870000586.
- ↑ Atkinson, Frank B. (2006). The Dynamic Dominion: Realignment and the Rise of Two-party Competition in Virginia, 1945-1980. Rowman & Littlefield. ISBN 9780742552098.
- ↑ Evans, Rowland; Novak, Robert (October 16, 1972). "Consider Virginia: McGovern, Nixon Creating a No-Party System in South". The Miami Herald. pp. 7-A.
- ↑ Wharton, Elizabeth (October 3, 1980). "Carter, Reagan Stump Virginia". Ukiah Daily Journal. Ukiah, California. p. 2.
- ↑ "Byrd Says He'll Vote for Reagan". Daily Press. Newport News, Virginia. October 15, 1980. p. 3.
- ↑ Black & Black 1992, p. 295.
- ↑ Black & Black 1992, p. 335.
- ↑ Mears, Walter R. (October 26, 1980). "Carter–Reagan Race Tightens Near Finish". Kansas City Star. pp. 1A, 14A.
- ↑ Beagle, Ben (October 26, 1980). "Survey Says Reagan Leading by 9% in Virginia". The Roanoke Times. Roanoke, Virginia. pp. 1, 3.
- ↑ "Survey Says Reagan is 68 Votes Short". Richmond Times-Dispatch. Richmond, Virginia. October 26, 1980. p. A-2.
- ↑ "Down by the Wire: State by State, It's Just too Close to Call". Daily Press. Victorville, California. November 3, 1980. p. B-1.
- ↑ "Statistics of the Congressional Election of November 4, 1980" (PDF). clerk.house.gov. Archived (PDF) from the original on March 20, 2022.
- ↑ "VA US Presidential Race, November 04, 1980". Our Campaigns.
- ↑ Politics in America (Report). Congressional Quarterly, inc. 1981. pp. 1234–1251.
- ↑ "1980 Presidential General Election Results — Virginia". uselectionatlas.org. Dave Leip’s Atlas of U.S. Presidential Elections. Retrieved May 25, 2023.
- ↑ "1980 Presidential General Election Data — National". uselectionatlas.org. Dave Leip’s Atlas of U.S. Presidential Elections. Retrieved May 25, 2023.
- ↑ Sullivan, Robert David; ‘How the Red and Blue Map Evolved Over the Past Century’; America Magazine in The National Catholic Review; June 29, 2016
Works cited
- Black, Earl; Black, Merle (1992). The Vital South: How Presidents Are Elected. Harvard University Press. ISBN 0674941306.