| |||||||||||||||||||||||||||||||||||||||||||||||||||||||||||||
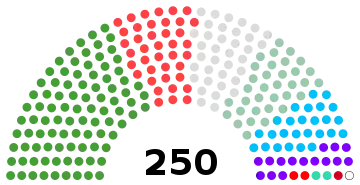
128 of the 250 seats in the House of Councillors 126 seats needed for a majority | |||||||||||||||||||||||||||||||||||||||||||||||||||||||||||||
|---|---|---|---|---|---|---|---|---|---|---|---|---|---|---|---|---|---|---|---|---|---|---|---|---|---|---|---|---|---|---|---|---|---|---|---|---|---|---|---|---|---|---|---|---|---|---|---|---|---|---|---|---|---|---|---|---|---|---|---|---|---|
| |||||||||||||||||||||||||||||||||||||||||||||||||||||||||||||
| |||||||||||||||||||||||||||||||||||||||||||||||||||||||||||||


| This article is part of a series on |
| Politics of Japan |
|---|
 |
|
|
|
|
House of Councillors elections were held in Japan on 24 April 1953,[1] electing half the seats in the House. The Yoshida faction of the Liberal Party won the most seats.
Results
 | ||||||||||||
|---|---|---|---|---|---|---|---|---|---|---|---|---|
| Party | National | Constituency | Seats | |||||||||
| Votes | % | Seats | Votes | % | Seats | Not up | Won | Total after | +/– | |||
| Liberal Party | 6,149,927 | 22.75 | 16 | 8,803,131 | 31.43 | 30 | 47 | 46 | 93 | +17 | ||
| Left Socialist Party of Japan | 3,858,552 | 14.27 | 8 | 3,917,837 | 13.99 | 10 | 22 | 18 | 40 | New | ||
| Ryokufūkai | 3,301,011 | 12.21 | 8 | 2,096,103 | 7.48 | 8 | 18 | 16 | 34 | –16 | ||
| Right Socialist Party of Japan | 1,740,423 | 6.44 | 3 | 2,952,803 | 10.54 | 7 | 16 | 10 | 26 | New | ||
| Kaishintō | 1,630,507 | 6.03 | 3 | 2,840,345 | 10.14 | 5 | 7 | 8 | 15 | New | ||
| Japanese Communist Party | 293,877 | 1.09 | 0 | 264,729 | 0.95 | 0 | 1 | 0 | 1 | –3 | ||
| Labourers and Farmers Party | 112,535 | 0.42 | 0 | 277,442 | 0.99 | 0 | 2 | 0 | 2 | –3 | ||
| Liberal Party–Hatoyama | 110,889 | 0.41 | 0 | 522,540 | 1.87 | 0 | 2 | 0 | 2 | New | ||
| Other parties | 332,898 | 1.23 | 0 | 322,674 | 1.15 | 1 | 0 | 1 | 1 | –2 | ||
| Independents | 9,504,220 | 35.16 | 15 | 6,013,363 | 21.47 | 14 | 7 | 29 | 36 | +14 | ||
| Total | 27,034,839 | 100.00 | 53 | 28,010,967 | 100.00 | 75 | 122 | 128 | 250 | 0 | ||
| Valid votes | 27,034,839 | 90.97 | 28,010,967 | 94.25 | ||||||||
| Invalid/blank votes | 2,682,584 | 9.03 | 1,707,952 | 5.75 | ||||||||
| Total votes | 29,717,423 | 100.00 | 29,718,919 | 100.00 | ||||||||
| Registered voters/turnout | 47,036,554 | 63.18 | 47,036,554 | 63.18 | ||||||||
| Source: Ministry of Internal Affairs and Communications,[1][2] National Diet | ||||||||||||
By constituency
| Prefecture | Total seats |
Seats won | ||||||
|---|---|---|---|---|---|---|---|---|
| LP | LSPJ | Ryokufūkai | RSPJ | Kaishintō | Others | Ind. | ||
| Aichi | 3 | 1 | 1 | 1 | ||||
| Akita | 1 | 1 | ||||||
| Aomori | 1 | 1 | ||||||
| Chiba | 2 | 1 | 1 | |||||
| Ehime | 1 | 1 | ||||||
| Fukui | 1 | 1 | ||||||
| Fukuoka | 3 | 1 | 1 | 1 | ||||
| Fukushima | 2 | 1 | 1 | |||||
| Gifu | 1 | 1 | ||||||
| Gunma | 2 | 1 | 1 | |||||
| Hiroshima | 2 | 1 | 1 | |||||
| Hokkaido | 4 | 1 | 1 | 1 | 1 | |||
| Hyōgo | 3 | 1 | 1 | 1 | ||||
| Ibaraki | 2 | 1 | 1 | |||||
| Ishikawa | 1 | 1 | ||||||
| Iwate | 1 | 1 | ||||||
| Kagawa | 1 | 1 | ||||||
| Kagoshima | 2 | 2 | ||||||
| Kanagawa | 2 | 1 | 1 | |||||
| Kōchi | 1 | 1 | ||||||
| Kumamoto | 2 | 1 | 1 | |||||
| Kyoto | 2 | 1 | 1 | |||||
| Mie | 1 | 1 | ||||||
| Miyagi | 1 | 1 | ||||||
| Miyazaki | 1 | 1 | ||||||
| Nagano | 2 | 1 | 1 | |||||
| Nagasaki | 1 | 1 | ||||||
| Nara | 1 | 1 | ||||||
| Niigata | 2 | 1 | 1 | |||||
| Ōita | 1 | 1 | ||||||
| Okayama | 2 | 1 | 1 | |||||
| Osaka | 3 | 1 | 1 | 1 | ||||
| Saga | 1 | 1 | ||||||
| Saitama | 2 | 1 | 1 | |||||
| Shiga | 1 | 1 | ||||||
| Shimane | 1 | 1 | ||||||
| Shizuoka | 2 | 1 | 1 | |||||
| Tochigi | 2 | 1 | 1 | |||||
| Tokushima | 1 | 1 | ||||||
| Tokyo | 4 | 2 | 1 | 1 | ||||
| Tottori | 1 | 1 | ||||||
| Toyama | 1 | 1 | ||||||
| Wakayama | 1 | 1 | ||||||
| Yamagata | 1 | 1 | ||||||
| Yamaguchi | 1 | 1 | ||||||
| Yamanashi | 1 | 1 | ||||||
| National | 53 | 16 | 8 | 8 | 3 | 3 | 15 | |
| Total | 128 | 47 | 19 | 15 | 10 | 8 | 1 | 28 |
Aftermath
In the national constituency, a polling station in Sano, Tochigi accidentally had Japan Socialist Party candidate Takeshi Hirabayashi labelled as belonging to the Japanese Communist Party. As a result, the results in Sano were invalidated through an appeal decision of the Supreme Court on 24 September 1954. A re-vote was held on 17 October 1954 with proper labels, and Hirabayashi narrowly won a spot in the lower ranks of the national constituency results.[3]
References
- 1 2 Table 13: Persons Elected and Votes Polled by Political Parties - Ordinary Elections for the House of Councillors (1947–2004) Archived 2011-03-23 at the Wayback Machine Ministry of Internal Affairs and Communications
- ↑ "27-11 Allotted Number, Candidates, Eligible Voters as of Election Day, Voters and Voting Percentages of Ordinary Elections for the House of Councillors (1947-2004)". Ministry of Internal Affairs and Communications. Archived from the original on 2006-01-04.
- ↑ 参議院事務局編『参議院議員選挙一覧 第3回』参議院事務局、1955年。
| General elections | |
|---|---|
| Councillors elections | |
| Unified local elections | |
| Supreme Court retention elections |
|
| |
This article is issued from Wikipedia. The text is licensed under Creative Commons - Attribution - Sharealike. Additional terms may apply for the media files.