| |||||||||||||||||||||||||||||||||||||||||||||||||||||||||||
| Registered | 3,737,145 | ||||||||||||||||||||||||||||||||||||||||||||||||||||||||||
|---|---|---|---|---|---|---|---|---|---|---|---|---|---|---|---|---|---|---|---|---|---|---|---|---|---|---|---|---|---|---|---|---|---|---|---|---|---|---|---|---|---|---|---|---|---|---|---|---|---|---|---|---|---|---|---|---|---|---|---|
| Turnout | 44.7 | ||||||||||||||||||||||||||||||||||||||||||||||||||||||||||
| |||||||||||||||||||||||||||||||||||||||||||||||||||||||||||
 Colours denote the winning party with outright control | |||||||||||||||||||||||||||||||||||||||||||||||||||||||||||
.tif.jpg.webp)
.jpg.webp)
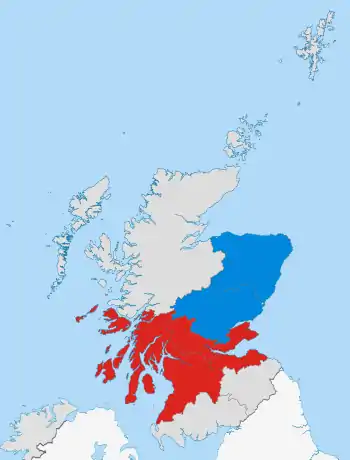
Regional elections were held in Scotland on Tuesday 2 May 1978, as part of the Local Government (Scotland) Act 1973. They saw a resurgence of support for the Labour Party, retaining control of Strathclyde and Fife and winning Central and Lothian.[1]
National results
| Parties | Votes | Votes % | Wards | |
|---|---|---|---|---|
| Labour | 592,616 | 39.6 | 176 | |
| Conservative | 453,003 | 30.3 | 136 | |
| SNP | 313,062 | 20.9 | 18 | |
| Liberal | 34,284 | 2.3 | 6 | |
| Communist | 7,884 | 0.5 | 1 | |
| SLP | 6,629 | 0.4 | 0 | |
| Independent Ratepayer | 5,754 | 0.4 | 1 | |
| Independent Labour | 4,841 | 0.3 | 1 | |
| Independent Nationalist | 2,447 | 0.2 | 2 | |
| Independent Liberal | 1,291 | 0.1 | 0 | |
| Workers Revolutionary | 168 | 0.01 | 0 | |
| Independent | 73,449 | 4.9 | 89 | |
| Total | 1,495,428 | 100.0 | 431 | |
Results by council area
| Council[5][6] | Labour | Conservative | SNP | Liberal & SDP | Independent | Other | Turnout | Control |
Details | |
|---|---|---|---|---|---|---|---|---|---|---|
| Borders‡ | 0 | 9 | 1 | 1 | 11 | 1 | Independent hold | Details | ||
| Central‡ | 18 | 6 | 6 | 0 | 2 | 2 | Labour Gain | Details | ||
| Dumfries and Galloway‡ | 3 | 5 | 1 | 0 | 26 | 0 | Independent hold | Details | ||
| Fife‡ | 24 | 14 | 1 | 0 | 2 | 1 | Labour hold | Details | ||
| Grampian‡ | 13 | 33 | 2 | 2 | 3 | 0 | Conservative Hold | Details | ||
| Highland‡ | 5 | 1 | 2 | 2 | 37 | 0 | Independent Hold | Details | ||
| Lothian‡ | 26 | 18 | 3 | 1 | 1 | 0 | Labour Gain | Details | ||
| Orkney‡ | 0 | 0 | 0 | 0 | 24 | Independent Hold | Details | |||
| Shetland‡ | 3 | 0 | 0 | 0 | 22 | Independent Hold | Details | |||
| Strathclyde‡ | 73 | 25 | 2 | 2 | 1 | 0 | Labour Hold | Details | ||
| Tayside‡ | 15 | 25 | 0 | 0 | 6 | 0 | Conservative Hold | Details | ||
| Na h-Eileanan Siar (Western Isles)‡ | 0 | 0 | 0 | 0 | 30 | 0 | Independent Hold | Details | ||
References
- ↑ "Google News Archive Search". news.google.com.
- ↑ McConnell, Alan (2004), Scottish Local Government, Edinburgh University Press, ISBN 978-0-7486-2005-0
- ↑ Rallings, Colin; Thrasher, Michael (2013). Local Elections in Britain. Routledge. pp. Table 7.5.
- ↑ Bochel, J. M.; Denver, D. T.; McHardy, B. J. Scottish Regional Election 1978: Results and Statistics. University of Dundee and University of Lancaster. pp. 59–63.
- ↑ "The Glasgow Herald - Google News Archive Search". news.google.com.
- ↑ "The Glasgow Herald - Google News Archive Search". news.google.com.
| Scottish Parliament | |
|---|---|
| Parliament of Scotland |
|
| Convention of Estates |
|
| UK Parliament |
|
| Local elections | |
| Referendums | |
| London boroughs |
|
|---|---|
| Metropolitan boroughs |
|
| District councils (England) |
|
| Regional councils (Scotland) |
|
This article is issued from Wikipedia. The text is licensed under Creative Commons - Attribution - Sharealike. Additional terms may apply for the media files.