| |||||||||||||||||||||||||||||||||||||||||||||||||||||||||||||||||
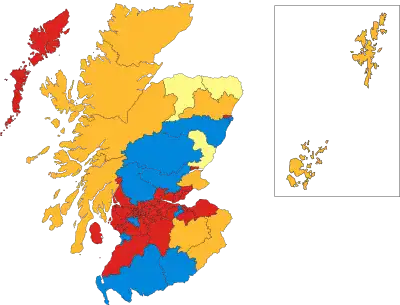
All 72 Scottish seats to the House of Commons | |||||||||||||||||||||||||||||||||||||||||||||||||||||||||||||||||
|---|---|---|---|---|---|---|---|---|---|---|---|---|---|---|---|---|---|---|---|---|---|---|---|---|---|---|---|---|---|---|---|---|---|---|---|---|---|---|---|---|---|---|---|---|---|---|---|---|---|---|---|---|---|---|---|---|---|---|---|---|---|---|---|---|---|
| Turnout | 75.5%, | ||||||||||||||||||||||||||||||||||||||||||||||||||||||||||||||||
| |||||||||||||||||||||||||||||||||||||||||||||||||||||||||||||||||
 Results of the 1992 election in Scotland | |||||||||||||||||||||||||||||||||||||||||||||||||||||||||||||||||
A general election was held in the United Kingdom on 9 April 1992 and all 72 seats in Scotland were contested. Two Scottish seats changed parties during the election; Aberdeen South and Kincardine and Deeside. Both seats were gained by the Conservatives. Kincardine and Deeside had been lost by the Conservatives to the Liberal Democrats in the last by-election of the parliament.[1]
The results of the 1992 election were largely unexpected, and nowhere more-so than in Scotland. Conservative results in Scottish local elections since the 1987 election had been largely poor, and the Conservatives had sunk as low as 15% in a March 1990 opinion poll by the Herald. Polling throughout the campaign had suggested little movement towards the Conservatives, and instead support for Scottish independence appeared to be rising. Local polls in individual constituencies had even suggested that the Secretary of State for Scotland Ian Lang would lose his seat of Galloway and Upper Nithsdale to the SNP and that Under-Secretary of State for Scotland Michael Forsyth would lose Stirling to Labour.[1]
Most surprising was the difference between the Scottish results and the wider UK results. The tendency had historically been for larger swings to Labour in Scotland where there was a national swing to Labour. In 1992 the wider swing in the UK was from the Conservatives to Labour, yet Scotland saw a swing from Labour to the Conservatives.[1] This was the last election until 2017 in which the Conservatives were the second largest party in Scotland (in the election held 25 years later, the Scottish Conservatives were the beneficiaries of a much larger swing against the trend elsewhere in the UK).
MPs
Results
| Party | Seats | Seats change |
Votes | % | % change | |
|---|---|---|---|---|---|---|
| Labour | 49 | 1,142,911 | 39.0 | |||
| Conservative | 11 | 751,950 | 25.6 | |||
| Liberal Democrats | 9 | 383,856 | 13.1 | |||
| SNP | 3 | 629,564 | 21.5 | |||
| Other | 0 | 23,417 | 0.8 | |||
| Turnout | 2,931,698 | 75.5 | ||||
Votes summary
References
- 1 2 3 Bochel, John; Denver, David (1 November 1992). "The 1992 general election in Scotland". Scottish Affairs. 1 (First Series) (1): 14–26. doi:10.3366/scot.1992.0005. hdl:1842/9159 – via Edinburgh University Press Journals.
.jpg.webp)
.jpg.webp)

.jpg.webp)