| |||||||||||||||||||||||||
11 of the 33 seats to City of Lincoln Council 17 seats needed for a majority | |||||||||||||||||||||||||
|---|---|---|---|---|---|---|---|---|---|---|---|---|---|---|---|---|---|---|---|---|---|---|---|---|---|
| |||||||||||||||||||||||||
 Map showing the results the 1996 Lincoln City Council elections by ward. Red shows Labour seats and blue shows Conservative seats. | |||||||||||||||||||||||||
| |||||||||||||||||||||||||
The 1996 City of Lincoln Council election took place on 2 May 1996. This was on the same day as other local elections. One third of the council was up for election: the seats of which were last contested in 1992. The Labour Party retained control of the council.
Overall results
| Party | Seats | Gains | Losses | Net gain/loss | Seats % | Votes % | Votes | +/− | |
|---|---|---|---|---|---|---|---|---|---|
| Labour | 11 | 2 | 0 | 100.0 | 69.4 | 14,161 | |||
| Conservative | 0 | 0 | 2 | 0.0 | 23.9 | 4,883 | |||
| Liberal Democrats | 0 | 0 | 0 | 0.0 | 1.2 | 243 | |||
| Green | 0 | 0 | 0 | 0.0 | 5.5 | 1,130 | |||
| Total | 11 | 20,417 | |||||||
All comparisons in vote share are to the corresponding 1992 election.
Ward results
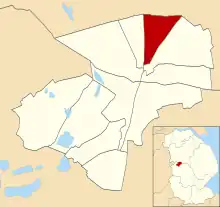
Abbey

Location of Abbey ward
| Party | Candidate | Votes | % | |
|---|---|---|---|---|
| Labour | J. Robertson | 1,190 | 79.2% | |
| Conservative | P. Forbes-Ritte | 208 | 13.8% | |
| Green | P. North | 104 | 6.9% | |
| Turnout | 30.2% | |||
| Labour hold | ||||
Birchwood

Location of Birchwood ward
| Party | Candidate | Votes | % | |
|---|---|---|---|---|
| Labour | Stephen Allnutt[4] | 1,820 | 58.9% | |
| Conservative | Edmund Strengiel[5] | 1,147 | 37.1% | |
| Green | T. Ligema | 121 | 3.9% | |
| Turnout | 32.4% | |||
| Labour gain from Conservative | ||||
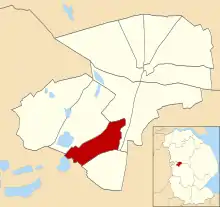
Boultham

Location of Boultham ward
| Party | Candidate | Votes | % | |
|---|---|---|---|---|
| Labour | Ralph Toofany[6] | 1,221 | 76.5% | |
| Conservative | M. Franks | 268 | 16.8% | |
| Green | G. Phillips | 108 | 6.8% | |
| Turnout | 30.9% | |||
| Labour hold | ||||
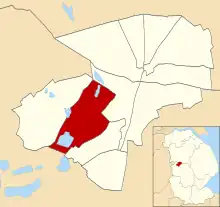
Bracebridge

Location of Bracebridge ward
| Party | Candidate | Votes | % | |
|---|---|---|---|---|
| Labour | A. Bradley | 1,273 | 69.0% | |
| Conservative | R. Meads | 491 | 26.6% | |
| Green | R. Leedham-Green | 80 | 4.3% | |
| Turnout | 30.7% | |||
| Labour hold | ||||
Carholme

Location of Carholme ward
| Party | Candidate | Votes | % | |
|---|---|---|---|---|
| Labour | S. Paterson | 1,264 | 60.8% | |
| Conservative | M. Mellows | 402 | 19.3% | |
| Liberal Democrats | L. Gabriel | 243 | 11.7% | |
| Green | D. Kane | 171 | 8.2% | |
| Turnout | 38.3% | |||
| Labour hold | ||||
Castle

Location of Castle ward
| Party | Candidate | Votes | % | |
|---|---|---|---|---|
| Labour | Loraine Woolley[7] | 1,324 | 75.1% | |
| Conservative | B. Tibble | 334 | 19.0% | |
| Green | E. Gurney | 104 | 5.9% | |
| Turnout | 33.4% | |||
| Labour hold | ||||
Longdales
Location of Longdales ward
| Party | Candidate | Votes | % | |
|---|---|---|---|---|
| Labour | P. McGinlay | 1,216 | 69.5% | |
| Conservative | David Gratrick[8] | 476 | 27.2% | |
| Green | A. Hansell | 57 | 3.3% | |
| Turnout | 36.6% | |||
| Labour hold | ||||
Minster
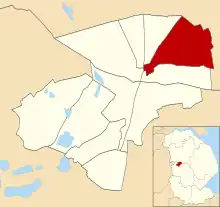
Location of Minster ward
| Party | Candidate | Votes | % | |
|---|---|---|---|---|
| Labour | Lawrence Wells[9] | 1,648 | 65.3% | |
| Conservative | C. Talbor | 719 | 28.5% | |
| Green | A. Smith | 156 | 6.2% | |
| Turnout | 34.4% | |||
| Labour hold | ||||
Moorland
Location of Moorland ward
| Party | Candidate | Votes | % | |
|---|---|---|---|---|
| Labour | N. Baldock | 1,192 | 70.7% | |
| Conservative | D. Fraser | 410 | 24.3% | |
| Green | L. Durrant | 84 | 5.0% | |
| Turnout | 34.5% | |||
| Labour gain from Conservative | ||||
Park

Location of Park ward
| Party | Candidate | Votes | % | |
|---|---|---|---|---|
| Labour | Y. Jackson | 868 | 73.6% | |
| Conservative | B. Briggs | 223 | 18.9% | |
| Green | K. Yates | 88 | 7.5% | |
| Turnout | 23.9% | |||
| Labour hold | ||||
Tritton
Location of Tritton ward
| Party | Candidate | Votes | % | |
|---|---|---|---|---|
| Labour | Richard Coupland[6] | 1,145 | 81.4% | |
| Conservative | M. Clark | 205 | 14.6% | |
| Green | R. Weavers | 57 | 4.1% | |
| Turnout | 33.9% | |||
| Labour hold | ||||
By-elections between 1996 and 1998
| Party | Candidate | Votes | % | |
|---|---|---|---|---|
| Labour | 841 | 54.6 | ||
| Conservative | 380 | 24.7 | ||
| Independent | 223 | 14.5 | ||
| Green | 95 | 6.2 | ||
| Majority | 461 | 29.9 | ||
| Turnout | 1,539 | 28.3 | ||
| Labour hold | ||||
References
- ↑ "Council compositions by year". The Elections Centre.
- ↑ "Local Election Summaries 1996". The Elections Centre.
- 1 2 3 4 5 6 7 8 9 10 11 "City of Lincoln Council Election Results 1973-2012". Elections Centre. Retrieved 29 October 2019.
- ↑ "City of Lincoln Council - Your council". City of Lincoln Council. Archived from the original on 12 May 2003. Retrieved 4 November 2019.
- ↑ "City of Lincoln Council - Your council". City of Lincoln Council. Archived from the original on 25 January 2003. Retrieved 4 November 2019.
- 1 2 "Councillors - Boultham ward". Archived from the original on 19 April 2003. Retrieved 4 November 2019.
- ↑ "Councillors - Castle ward". Archived from the original on 19 April 2003. Retrieved 4 November 2019.
- ↑ "Councillors - Minster ward". Archived from the original on 19 April 2003. Retrieved 4 November 2019.
- ↑ "Councillors - Glebe ward". Archived from the original on 19 April 2003. Retrieved 5 November 2019.
- ↑ Keith Edkins. "Local Authority Byelection Results - May 1997". Archived from the original on 31 August 2020. Retrieved 6 November 2019.
| Lincolnshire County Council | |||||||||||||||||||||
|---|---|---|---|---|---|---|---|---|---|---|---|---|---|---|---|---|---|---|---|---|---|
| Boston Borough Council | |||||||||||||||||||||
| East Lindsey District Council | |||||||||||||||||||||
| City of Lincoln Council | |||||||||||||||||||||
| North East Lincolnshire Council | |||||||||||||||||||||
| North Kesteven District Council | |||||||||||||||||||||
| North Lincolnshire Council | |||||||||||||||||||||
| South Holland District Council | |||||||||||||||||||||
| South Kesteven District Council | |||||||||||||||||||||
| West Lindsey District Council | |||||||||||||||||||||
| |||||||||||||||||||||
| |||||||||||||||||||||
| Metropolitan boroughs |
|
|---|---|
| Unitary authorities |
|
| District councils |
|
| Ad-hoc election | |
This article is issued from Wikipedia. The text is licensed under Creative Commons - Attribution - Sharealike. Additional terms may apply for the media files.