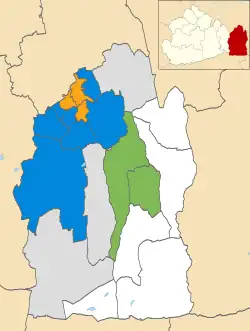
Map showing the results of the 2021 Tandridge District Council election
The 2021 Tandridge District Council election took place on 6 May 2021 to elect members of Tandridge District Council in England.[1] This was on the same day as other local elections.
Ward results
Asterisk indicates incumbent Councillor seeking re-election.
Bletchingley & Nutfield
| Party | Candidate | Votes | % | ±% | |
|---|---|---|---|---|---|
| Conservative | Liam Hammond | 815 | 43 | ||
| Independent | Chris Pinard | 606 | 32 | ||
| Liberal Democrats | Richard Fowler | 303 | 16 | ||
| Labour | Linda Baharier | 158 | 8 | ||
| Majority | 209 | 11 | |||
| Turnout | 1,888 | 40.17 | |||
| Conservative hold | Swing | ||||
Burstow, Horne & Outwood
| Party | Candidate | Votes | % | ±% | |
|---|---|---|---|---|---|
| Independent | Mick Gillman | 691 | 41 | ||
| Conservative | Harry Fitzgerald* | 667 | 39 | ||
| Liberal Democrats | Judy Wilkinson | 127 | 7 | ||
| Independent | Andrea Moss | 107 | 6 | ||
| Green | Jack Baart | 105 | 6 | ||
| Majority | 24 | 2 | |||
| Turnout | 1,705 | 33.63 | |||
| Independent gain from Conservative | Swing | ||||
Chaldon
| Party | Candidate | Votes | % | ±% | |
|---|---|---|---|---|---|
| Conservative | Phil Flower | 431 | 61 | ||
| Liberal Democrats | Neil Parker | 262 | 37 | ||
| Majority | 169 | 24 | |||
| Turnout | 1,470 | 48.4 | |||
| Conservative hold | Swing | ||||
Godstone
| Party | Candidate | Votes | % | ±% | |
|---|---|---|---|---|---|
| Independent | Mike Crane | 1,104 | 61 | ||
| Conservative | Eileen Blake-Thomas* | 451 | 25 | ||
| Liberal Democrats | Martin Redman | 120 | 7 | ||
| Labour | Barbara Wantling | 120 | 7 | ||
| Majority | 653 | 36 | |||
| Turnout | 1,802 | 37.69 | |||
| Independent gain from Conservative | Swing | ||||
Harestone
| Party | Candidate | Votes | % | ±% | |
|---|---|---|---|---|---|
| Conservative | Michael Cooper* | 581 | 40 | ||
| Liberal Democrats | Annette Evans | 557 | 39 | ||
| Independent | Clare Heaton | 187 | 13 | ||
| Labour | Anita Mills | 114 | 8 | ||
| Majority | 24 | 1 | |||
| Turnout | 1,452 | 44.7 | |||
| Conservative hold | Swing | ||||
Oxted North & Tandridge
| Party | Candidate | Votes | % | ±% | |
|---|---|---|---|---|---|
| Oxted & Limpsfield Residents' Group | Jackie Wren* | 1,779 | 77 | ||
| Conservative | Alex Standen | 324 | 14 | ||
| Liberal Democrats | Rupert McCann | 119 | 13 | ||
| Labour | Jonathan Wheale | 81 | 3 | ||
| Majority | 1,455 | 63 | |||
| Turnout | 2,316 | 48.2 | |||
| Oxted & Limpsfield Residents' Group hold | Swing | ||||
Oxted South
| Party | Candidate | Votes | % | ±% | |
|---|---|---|---|---|---|
| Oxted & Limpsfield Residents' Group | Deb Shiner | 1,048 | 50 | ||
| Conservative | Elizabeth Parker* | 709 | 34 | ||
| Labour | Samuel Kerr | 243 | 12 | ||
| Liberal Democrats | Martin Caxton | 78 | 4 | ||
| Majority | 339 | 17 | |||
| Turnout | 2,086 | 41.14 | |||
| Oxted & Limpsfield Residents' Group gain from Conservative | |||||
Portley
| Party | Candidate | Votes | % | ±% | |
|---|---|---|---|---|---|
| Liberal Democrats | Chris Botten* | 682 | 54 | ||
| Conservative | Maria Grasso | 458 | 36 | ||
| Labour | Ian Giddings | 105 | 8 | ||
| Majority | 224 | 18 | |||
| Turnout | 1,258 | 35.1 | |||
| Liberal Democrats hold | Swing | ||||
Queen's Park
| Party | Candidate | Votes | % | ±% | |
|---|---|---|---|---|---|
| Conservative | Matthew Groves | 575 | 45 | ||
| Conservative | Geoffrey Duck* | 561 | 44 | ||
| Liberal Democrats | Vicky Robinson | 496 | 39 | ||
| Liberal Democrats | James Rujbally | 376 | 29 | ||
| Labour | Roy Stewart | 126 | 10 | ||
| Labour | Roger Vince | 96 | 8 | ||
| Majority | 65 | 5 | |||
| Turnout | 1,595 | 43 | |||
| Conservative hold | Swing | ||||
| Conservative gain from Liberal Democrats | Swing | ||||
Valley
| Party | Candidate | Votes | % | ±% | |
|---|---|---|---|---|---|
| Liberal Democrats | Jenny Gaffney | 645 | 60 | ||
| Liberal Democrats | Alun Jones* | 606 | 56 | ||
| Conservative | Victor Emmanuel | 271 | 25 | ||
| Conservative | David Knight | 263 | 24 | ||
| Labour | Caz Lessey | 99 | 9 | ||
| Labour | Wayne Chuter | 81 | 7 | ||
| Independent | Peter Roberts | 78 | 7 | ||
| Jeffrey Bolter | 59 | 5 | |||
| Majority | 335 | 31 | |||
| Turnout | 1,081 | 32.6 | |||
| Liberal Democrats hold | Swing | ||||
| Liberal Democrats hold | Swing | ||||
Warlingham East, Chelsham & Farleigh
| Party | Candidate | Votes | % | ±% | |
|---|---|---|---|---|---|
| Independent | Jeremy Pursehouse* | 1,057 | 59 | ||
| Conservative | Nathan Adams | 458 | 26 | ||
| Labour | Mark Wilson | 130 | 7 | ||
| Independent | Martin Haley | 126 | 7 | ||
| Majority | 599 | 33 | |||
| Turnout | 1,806 | 38.3 | |||
| Independent hold | Swing | ||||
Warlingham West
| Party | Candidate | Votes | % | ±% | |
|---|---|---|---|---|---|
| Conservative | Keith Prew | 726 | 60 | ||
| Liberal Democrats | Neill Cooper | 405 | 33 | ||
| Labour | David Manning | 66 | 5 | ||
| Majority | 321 | 27 | |||
| Turnout | 1,210 | 40.37 | |||
| Conservative hold | Swing | ||||
Westway
| Party | Candidate | Votes | % | ±% | |
|---|---|---|---|---|---|
| Conservative | Taylor O'Driscoll | 491 | 40 | ||
| Liberal Democrats | Helen Rujbally* | 476 | 39 | ||
| Labour | Robin Clements | 186 | 15 | ||
| Independent | Helena Windsor | 67 | 5 | ||
| Majority | 15 | 1 | |||
| Turnout | 1,231 | 33.51 | |||
| Conservative gain from Liberal Democrats | Swing | ||||
Whyteleafe
| Party | Candidate | Votes | % | ±% | |
|---|---|---|---|---|---|
| Liberal Democrats | David Lee* | 522 | 47 | ||
| Conservative | Sakina Bradbury | 418 | 38 | ||
| Labour | Fatima Kamara | 153 | 14 | ||
| Majority | 104 | 9 | |||
| Turnout | 1,105 | 32.13 | |||
| Liberal Democrats hold | Swing | ||||
Woldingham
| Party | Candidate | Votes | % | ±% | |
|---|---|---|---|---|---|
| Conservative | Carole North | 479 | 69 | ||
| Liberal Democrats | Adam Farrar-Wilson | 133 | 19 | ||
| Labour | Nathan Manning | 77 | 11 | ||
| Majority | 346 | 50 | |||
| Turnout | 694 | 42.11 | |||
| Conservative hold | Swing | ||||
By-elections between 2021 and 2022
Felbridge (17 June 2021)
A by-election was held in Felbridge[2] on 17 June 2021 following the death of Conservative Councillor Ken Harwood in 2020.[3] This was due to take place on 6 May 2021, but was postponed following the death of the Labour candidate Christopher Kelly.[4]
| Party | Candidate | Votes | % | ±% | |
|---|---|---|---|---|---|
| Independent | Judy Moore | 264 | 45.4 | ||
| Independent | Mark Taylor | 159 | 27.4 | ||
| Conservative | Harry Baker-Smith | 128 | 22.0 | ||
| Labour | Emba Jones | 18 | 3.1 | ||
| Liberal Democrats | Richard Fowler | 12 | 2.1 | ||
| Majority | 105 | 18.0 | N/A | ||
| Turnout | 581 | 31.9 | |||
| Independent gain from Conservative | Swing | ||||
References
- ↑ "Elections to Tandridge District Council 2021". www.tandridge.gov.uk. Retrieved 21 May 2021.
- ↑ "Death of Sitting Cllr". 12 May 2020.
- ↑ "Felbridge By-Election". Archived from the original on 24 May 2021. Retrieved 24 May 2021.
- ↑ "Felbridge by-Election Postponed". 28 April 2021.
This article is issued from Wikipedia. The text is licensed under Creative Commons - Attribution - Sharealike. Additional terms may apply for the media files.