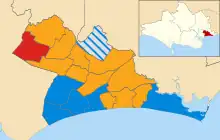
Map of results of 2003 election
Elections to Bournemouth Borough Council on the south coast of England were held on 1 May 2003. The whole council (a unitary authority) was up for election. The number of seats at this election was reduced from 57 to 54 (wards reduced from 19 to 18).
Election result
| Party | Seats | Gains | Losses | Net gain/loss | Seats % | Votes % | Votes | +/− | |
|---|---|---|---|---|---|---|---|---|---|
| Liberal Democrats | 33 | 15 | 0 | 15 | 61.1 | 44.86 | 49,728 | ||
| Conservative | 16 | 0 | 10 | -10 | 29.6 | 37.40 | 41,462 | ||
| Labour | 3 | 0 | 3 | -3 | 5.5 | 9.51 | 10,538 | ||
| Independent | 2 | 0 | 5 | -5 | 3.7 | 6.04 | 6,695 | ||
| UKIP | 0 | 0 | 0 | 0 | 0 | 1.66 | 1,839 | ||
| Dorset Stop the War | 0 | 0 | 0 | 0 | 0 | 0.27 | 299 | ||
| BNP | 0 | 0 | 0 | 0 | 0 | 0.26 | 293 | ||
This article is issued from Wikipedia. The text is licensed under Creative Commons - Attribution - Sharealike. Additional terms may apply for the media files.