| ||||||||||||||||||||||||||||||||||||||||
All 51 seats to Erewash Borough Council 26 seats needed for a majority | ||||||||||||||||||||||||||||||||||||||||
|---|---|---|---|---|---|---|---|---|---|---|---|---|---|---|---|---|---|---|---|---|---|---|---|---|---|---|---|---|---|---|---|---|---|---|---|---|---|---|---|---|
| ||||||||||||||||||||||||||||||||||||||||
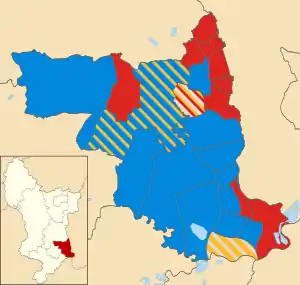
Map of the results of the 2003 Erewash Borough Council election. Conservatives in blue, Labour in red Liberal Democrats in yellow and independents in grey.
The 2003 Erewash Borough Council election took place on 1 May 2003 to elect members of Erewash Borough Council in Derbyshire, England. The whole council was up for election.[1]
Overall election results
Erewash Borough Council (Summary of Overall Results)
| Party | Seats | Gains | Losses | Net gain/loss | Seats % | Votes % | Votes | +/− | |
|---|---|---|---|---|---|---|---|---|---|
| Conservative | 26 | 51 | 41.2 | 11,124 | |||||
| Labour | 19 | 37 | 31.7 | 8552 | |||||
| Liberal Democrats | 4 | 8 | 16.8 | 4525 | |||||
| Independent | 2 | 4 | 8.2 | 2211 | |||||
| BNP | 0 | 1.0 | 282 | ||||||
| Monster Raving Loony | 0 | 1.0 | 154 | ||||||
| UKIP | 0 | 0.5 | 123 | ||||||
Erewash Borough Council - Results by Ward
Abbotsford
| Party | Candidate | Votes | % | ±% | |
|---|---|---|---|---|---|
| Labour | Michelle Booth (E) | 457 | 27.5 | ||
| Labour | Brian Lucas (E) | 451 | 27.2 | ||
| Conservative | Terence Holbrook | 405 | 24.4 | ||
| Conservative | Joyce Stokes | 347 | 20.9 | ||
| Turnout | 23.6 | ||||
Breaston
| Party | Candidate | Votes | % | ±% | |
|---|---|---|---|---|---|
| Conservative | Margaret Orchard (E) | 1032 | 37.0 | ||
| Conservative | Robert Alan Parkinson (E) | 973 | 34.9 | ||
| Labour | Susan Bradley | 419 | 15.0 | ||
| Labour | Graeme Simpson | 362 | 13.0 | ||
| Turnout | 40.8 | ||||
Cotmanhay
| Party | Candidate | Votes | % | ±% | |
|---|---|---|---|---|---|
| Labour | Marion Birch (E) | 352 | 30.3 | ||
| Labour | David Morgan (E) | 326 | 28.0 | ||
| Conservative | Eileen Richards | 264 | 22.7 | ||
| Conservative | Kenneth Tapping | 221 | 19.0 | ||
| Turnout | 19.6 | ||||
Derby Road East
| Party | Candidate | Votes | % | ±% | |
|---|---|---|---|---|---|
| Labour | Howard Griffiths (E) | 413 | 25.1 | ||
| Labour | Margaret Wright (E) | 377 | 22.9 | ||
| Conservative | Linda Corbett | 229 | 13.9 | ||
| Conservative | Jeffrey Clare | 216 | 13.1 | ||
| Liberal Democrats | Frederick Davis | 209 | 12.7 | ||
| Liberal Democrats | Andrew Read | 199 | 12.1 | ||
| Turnout | 25.0 | ||||
Derby Road West
| Party | Candidate | Votes | % | ±% | |
|---|---|---|---|---|---|
| Conservative | John Marshall (E) | 625 | 15.1 | ||
| Conservative | Ronald Chadbourne (E) | 582 | 14.1 | ||
| Conservative | Kevin Miller (E) | 565 | 13.7 | ||
| Labour | David Andrews | 433 | 10.5 | ||
| Labour | Alison Cartwright | 422 | 10.2 | ||
| Labour | Marjorie Avill-Coates | 404 | 9.8 | ||
| Liberal Democrats | Ian Neill | 396 | 9.6 | ||
| Liberal Democrats | Kevin Stevenson | 352 | 8.5 | ||
| Liberal Democrats | Anthony Oldham | 347 | 8.4 | ||
| Turnout | 31.2 | ||||
Draycott and Stanton-by-Dale
| Party | Candidate | Votes | % | ±% | |
|---|---|---|---|---|---|
| Conservative | Derek Orchard (E) | 744 | 37.1 | ||
| Conservative | Malcolm Aindow (E) | 567 | 28.3 | ||
| Independent | Peter Cresswell | 391 | 19.5 | ||
| Independent | Mark O'Neill | 304 | 15.2 | ||
| Turnout | 37.4 | ||||
Hallam Fields
| Party | Candidate | Votes | % | ±% | |
|---|---|---|---|---|---|
| Labour | Edward Bishop (E) | 521 | 33.2 | ||
| Labour | John Dunkley (E) | 460 | 29.3 | ||
| Conservative | Marie Aindow | 304 | 19.4 | ||
| Conservative | Roger Williams | 285 | 18.2 | ||
| Turnout | 24.3 | ||||
Ilkeston Central
| Party | Candidate | Votes | % | ±% | |
|---|---|---|---|---|---|
| Labour | Glennice Birkin (E) | 406 | 28.0 | ||
| Labour | Frank Charles Phillips (E) | 384 | 26.5 | ||
| Conservative | Jennifer Bartlett | 345 | 23.8 | ||
| Conservative | Victor Gillan | 314 | 21.7 | ||
| Turnout | 23.5 | ||||
Ilkeston North
| Party | Candidate | Votes | % | ±% | |
|---|---|---|---|---|---|
| Labour | Christopher Beardsley (E) | 339 | 33.3 | ||
| Labour | Ernest Bevan (E) | 335 | 32.9 | ||
| Conservative | Margaret Lomas | 183 | 18.0 | ||
| Conservative | Mary Smith | 162 | 15.9 | ||
| Turnout | 19.8 | ||||
Kirk Hallam
| Party | Candidate | Votes | % | ±% | |
|---|---|---|---|---|---|
| Independent | Brendan Killeavy (E) | 568 | 18.2 | ||
| Labour | Stephen Green (E) | 491 | 15.7 | ||
| Liberal Democrats | Eric Spencer (E) | 421 | 13.5 | ||
| Labour | Louis Booth | 415 | 13.3 | ||
| Labour | Richard Stevens | 361 | 11.5 | ||
| Liberal Democrats | Martin Prior | 288 | 9.2 | ||
| Conservative | Andrew Blount | 228 | 7.3 | ||
| Conservative | Nicola Stephenson | 210 | 6.7 | ||
| Conservative | John Hay-Heddle | 144 | 4.6 | ||
| Turnout | 26.8 | ||||
Little Eaton and Breadsall
| Party | Candidate | Votes | % | ±% | |
|---|---|---|---|---|---|
| Conservative | Brian Smith (E) | 519 | 27.0 | ||
| Conservative | Alan Summerfield (E) | 483 | 25.1 | ||
| Liberal Democrats | John Salmon | 408 | 21.2 | ||
| Liberal Democrats | Richard Beardmore | 307 | 15.9 | ||
| Labour | William Newman | 204 | 10.6 | ||
| Turnout | 38.5 | ||||
Little Hallam
| Party | Candidate | Votes | % | ±% | |
|---|---|---|---|---|---|
| Conservative | Bridget Harrison (E) | 602 | 33.4 | ||
| Conservative | David Stephenson (E) | 591 | 32.8 | ||
| Labour | Simon Haydon | 312 | 17.3 | ||
| Labour | Jean Shooter | 298 | 16.5 | ||
| Turnout | 33.0 | ||||
Long Eaton Central
| Party | Candidate | Votes | % | ±% | |
|---|---|---|---|---|---|
| Conservative | Robert Dockerill (E) | 560 | 14.0 | ||
| Conservative | Gary Hickton (E) | 534 | 13.3 | ||
| Conservative | Gerald Hartopp (E) | 531 | 13.2 | ||
| Labour | Paula Hosker | 514 | 12.8 | ||
| Labour | Charles Stevenson | 461 | 11.4 | ||
| Labour | Greta Stevenson | 433 | 10.8 | ||
| Liberal Democrats | Rachel Allen | 252 | 6.3 | ||
| Liberal Democrats | Richard Grant | 202 | 5.0 | ||
| Liberal Democrats | Geoffrey Daxter | 202 | 5.0 | ||
| UKIP | David Bartrop | 123 | 3.1 | ||
| Turnout | 30.5 | ||||
Nottingham Road
| Party | Candidate | Votes | % | ±% | |
|---|---|---|---|---|---|
| Labour | Roland Hosker (E) | 629 | 17.6 | ||
| Labour | Brenda White (E) | 609 | 17.0 | ||
| Labour | Michael Grant (E) | 576 | 16.0 | ||
| Conservative | Mary Gough | 560 | 15.6 | ||
| Conservative | David Watson | 474 | 13.2 | ||
| Conservative | Frank Jones | 451 | 12.6 | ||
| BNP | John Pennington | 282 | 7.9 | ||
| Turnout | 29.4 | ||||
Ockbrook and Borrowash
| Party | Candidate | Votes | % | ±% | |
|---|---|---|---|---|---|
| Conservative | Douglas Hodges (E) | 1177 | 18.9 | ||
| Conservative | Vera Tumanow (E) | 1149 | 18.4 | ||
| Conservative | Patrick Smith (E) | 1055 | 17.0 | ||
| Labour | Kevin Bates | 830 | 13.3 | ||
| Labour | Eric Highton | 810 | 13.0 | ||
| Labour | Jeffrey Martin | 764 | 12.3 | ||
| Liberal Democrats | Zoe France | 220 | 3.5 | ||
| Liberal Democrats | Margaret Long | 214 | 3.4 | ||
| Turnout | 38.4 | ||||
Old Park
| Party | Candidate | Votes | % | ±% | |
|---|---|---|---|---|---|
| Labour | Pamela Phillips (E) | 369 | 30.5 | ||
| Labour | Patrick Thomas Moloney (E) | 347 | 28.7 | ||
| Conservative | Benjamin Miller | 265 | 21.9 | ||
| Conservative | Val Clare | 229 | 18.9 | ||
| Turnout | 22.2 | ||||
Sandiacre North
| Party | Candidate | Votes | % | ±% | |
|---|---|---|---|---|---|
| Conservative | Mike Wallis (E) | 453 | 23.8 | ||
| Conservative | Alan Hardy (E) | 451 | 23.7 | ||
| Labour | Marie Blacker | 431 | 22.7 | ||
| Labour | Martin Waring | 374 | 19.7 | ||
| Liberal Democrats | Pamela Hallam | 192 | 10.0 | ||
| Turnout | 30.0 | ||||
Sandiacre South
| Party | Candidate | Votes | % | ±% | |
|---|---|---|---|---|---|
| Conservative | Stephen Bilbie (E) | 572 | 24.9 | ||
| Conservative | Barbara Uren (E) | 551 | 24.0 | ||
| Liberal Democrats | Hazel Tilford | 508 | 22.1 | ||
| Liberal Democrats | Martin Garnett | 430 | 18.7 | ||
| Labour | Denis Barker | 236 | 10.3 | ||
| Turnout | 36.7 | ||||
Sawley
| Party | Candidate | Votes | % | ±% | |
|---|---|---|---|---|---|
| Independent | William Camm (E) | 1252 | 36.3 | ||
| Liberal Democrats | Craig France (E) | 685 | 19.9 | ||
| Liberal Democrats | Rodney Allen (E) | 494 | 14.3 | ||
| Labour | Jonathon Hemsley | 258 | 7.8 | ||
| Conservative | Brenda Gillan | 224 | 6.5 | ||
| Conservative | Haley Clare | 221 | 6.4 | ||
| Conservative | Brian Stokes | 162 | 4.7 | ||
| Monster Raving Loony | R U Seerius | 154 | 4.5 | ||
| Turnout | 37.7 | ||||
Stanley
| Party | Candidate | Votes | % | ±% | |
|---|---|---|---|---|---|
| Labour | Gail Newman (E) | 381 | 64.7 | ||
| Conservative | Dorothy Harling | 208 | 35.3 | ||
| Turnout | 34.5 | ||||
West Hallam and Dale Abbey
| Party | Candidate | Votes | % | ±% | |
|---|---|---|---|---|---|
| Conservative | Carol Hart (E) | 851 | 22.2 | ||
| Liberal Democrats | Gary Hamson (E) | 802 | 21.0 | ||
| Conservative | John Fildes (E) | 753 | 19.7 | ||
| Conservative | Michael Sherwood | 720 | 18.8 | ||
| Liberal Democrats | Janet Mallett | 702 | 18.3 | ||
| Turnout | 36.2 | ||||
Wilsthorpe
| Party | Candidate | Votes | % | ±% | |
|---|---|---|---|---|---|
| Conservative | Chris Corbett (E) | 774 | 21.5 | ||
| Conservative | Donna Briggs (E) | 709 | 19.7 | ||
| Conservative | John Brown (E) | 709 | 19.7 | ||
| Labour | Owen Llewellyn | 557 | 15.5 | ||
| Liberal Democrats | Sally Ann Wathen | 432 | 11.9 | ||
| Liberal Democrats | Malcolm Barnes | 423 | 10.2 | ||
| Turnout | 28.8 | ||||
By-Elections between May 2003 - May 2007
Little Eaton and Breadsall
| Party | Candidate | Votes | % | ±% | |
|---|---|---|---|---|---|
| Conservative | 627 | 63.0 | +17.1 | ||
| Liberal Democrats | 368 | 37.0 | +0.9 | ||
| Majority | 259 | 26.0 | |||
| Turnout | 995 | 35.2 | |||
| Conservative hold | Swing | ||||
Kirk Hallam
| Party | Candidate | Votes | % | ±% | |
|---|---|---|---|---|---|
| Labour | Louis Booth | 523 | 52.1 | +23.4 | |
| Liberal Democrats | 232 | 23.1 | -1.5 | ||
| Conservative | 120 | 11.9 | -1.4 | ||
| UKIP | 129 | 12.8 | +12.8 | ||
| Majority | 291 | 29.0 | |||
| Turnout | 1,004 | 21.2 | |||
| Labour hold | Swing | ||||
| Party | Candidate | Votes | % | ±% | |
|---|---|---|---|---|---|
| Labour | John Frudd | 707 | 77.0 | +24.9 | |
| Conservative | Max Alexander | 132 | 14.4 | +2.5 | |
| Liberal Democrats | Janet Mallett | 79 | 8.6 | -14.5 | |
| Majority | 575 | 62.6 | N/A | ||
| Turnout | 918 | 19.3 | |||
| Labour gain from Independent | Swing | ||||
Sawley
| Party | Candidate | Votes | % | ±% | |
|---|---|---|---|---|---|
| Conservative | John Hay-Heddle | 423 | 38.1 | +29.4 | |
| Labour | 348 | 31.4 | +21.4 | ||
| Liberal Democrats | 338 | 30.5 | 0.0 | ||
| Majority | 75 | 6.7 | N/A | ||
| Turnout | 1,109 | 21.7 | |||
| Conservative gain from Liberal Democrats | Swing | ||||
References
- ↑ "Local Elections Archive Project - 2003 - Erewash".
- ↑ "Local Authority Byelection Results - April 2004". Archived from the original on 22 January 2017. Retrieved 11 July 2016.
- ↑ "Labour edges ahead in byelections". guardian.co.uk. 29 October 2004. Retrieved 14 October 2009.
- ↑ "Labour romp it at Kirk Hallam". Ilkeston Advertiser. 10 November 2005. Retrieved 14 October 2009.
- ↑ "Tories make first council gain of new year". The Guardian. 18 January 2005.
This article is issued from Wikipedia. The text is licensed under Creative Commons - Attribution - Sharealike. Additional terms may apply for the media files.