| |||||||||||||||||||||||||||||||||
14 of the 42 seats to Basildon District Council 22 seats needed for a majority | |||||||||||||||||||||||||||||||||
|---|---|---|---|---|---|---|---|---|---|---|---|---|---|---|---|---|---|---|---|---|---|---|---|---|---|---|---|---|---|---|---|---|---|
| |||||||||||||||||||||||||||||||||
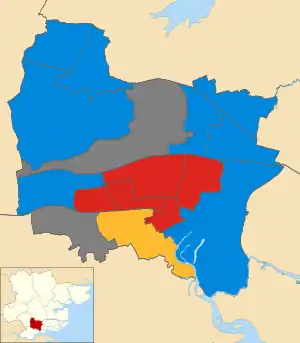
 Map of the results of the 2007 Basildon council election. Conservatives in blue, Labour in red and Liberal Democrats in yellow. Wards in grey were not contested in 2007. | |||||||||||||||||||||||||||||||||
| |||||||||||||||||||||||||||||||||
The 2007 Basildon District Council election took place on 3 May 2007 to elect members of Basildon District Council in Essex, England. One third of the council was up for election and the Conservative party stayed in overall control of the council.[4]
After the election, the composition of the council was
- Conservative 28
- Labour 11
- Liberal Democrats 3[5]
Campaign
The election saw the British National Party stand in 11 of the 14 wards being contested,[6] an increase from 6 in 2006 and more than the Liberal Democrats who only stood in 9 seats.[7]
There was controversy during the election over comments by the Conservative candidate in Vange, Luke Mackenzie, in an election leaflet where he called for voters who did not want asylum seekers to get council houses to vote Conservative.[6] Other parties called on the Conservatives to disown Mackenzie, who was standing against the only ethnic minority councillor in Basildon, saying he was "peddling scare stories" and that the comments were "inflammatory".[6] However Mackenzie denied increasing racial tension, saying voters felt immigration was "entirely out of control" and that a shortage of housing was caused by people from outside of Basildon,[6] and was defended by the leaders of the Conservative group in Basildon.[8]
Election result
The results saw the Conservative hold control of the council after gaining one seat from Labour.[9] The Conservatives took Laindon Park, but narrowly failed to take the targeted wards of Pitsea North West and Vange from Labour, by 19 and 68 votes respectively.[10] The Conservative share of the vote was down on the 2006 election at 43%, while Labour won 22%.[10] Overall turnout in the election was 30%, a decline from the 33.5% recorded in 2006.[10]
| Party | Seats | Gains | Losses | Net gain/loss | Seats % | Votes % | Votes | +/− | |
|---|---|---|---|---|---|---|---|---|---|
| Conservative | 8 | 1 | 0 | 57.1 | 43.2 | 14,823 | |||
| Labour | 5 | 0 | 1 | 35.7 | 22.3 | 7,656 | |||
| Liberal Democrats | 1 | 0 | 0 | 0 | 7.1 | 12.9 | 4,411 | ||
| BNP | 0 | 0 | 0 | 0 | 0 | 12.0 | 4,114 | ||
| Independent | 0 | 0 | 0 | 0 | 0 | 7.8 | 2,661 | ||
| UKIP | 0 | 0 | 0 | 0 | 0 | 1.2 | 397 | New | |
| Green | 0 | 0 | 0 | 0 | 0 | 0.6 | 211 | ||
All comparisons in vote share are to the corresponding 2003 election.
Ward results
Billericay East

| Party | Candidate | Votes | % | ±% | |
|---|---|---|---|---|---|
| Conservative | David Dadds | 1,373 | 44.2 | -28.3 | |
| Liberal Democrats | John James | 1,095 | 35.3 | +16.7 | |
| BNP | Laurence Long | 377 | 12.1 | +12.1 | |
| Labour | Patricia Reid | 259 | 8.3 | -0.6 | |
| Majority | 278 | 9.0 | -44.9 | ||
| Turnout | 3,104 | 34.2 | -3.9 | ||
| Conservative hold | Swing | ||||
Billericay West

| Party | Candidate | Votes | % | ±% | |
|---|---|---|---|---|---|
| Conservative | Stephen Horgan | 2,017 | 65.7 | +1.6 | |
| Liberal Democrats | Geoffrey Taylor | 473 | 15.4 | +0.3 | |
| BNP | Michael Bateman | 337 | 11.0 | -1.9 | |
| Labour | Margaret Viney | 244 | 7.9 | +0.1 | |
| Majority | 1,544 | 50.3 | +1.2 | ||
| Turnout | 3,071 | 32.7 | -3.5 | ||
| Conservative hold | Swing | ||||
Burstead

| Party | Candidate | Votes | % | ±% | |
|---|---|---|---|---|---|
| Conservative | Kevin Blake | 1,886 | 62.9 | -6.9 | |
| Liberal Democrats | Susan Haeger | 455 | 15.2 | -4.4 | |
| BNP | Linda Henry | 334 | 11.1 | +11.1 | |
| Labour | Santa Bennett | 325 | 10.8 | +0.2 | |
| Majority | 1,431 | 47.7 | -2.5 | ||
| Turnout | 3,000 | 36.2 | -3.8 | ||
| Conservative hold | Swing | ||||
Fryerns

| Party | Candidate | Votes | % | ±% | |
|---|---|---|---|---|---|
| Labour | Allan Davies | 1,092 | 42.1 | -1.6 | |
| Conservative | Mark Coker | 603 | 23.2 | +4.2 | |
| BNP | Leonard Heather | 595 | 22.9 | -2.4 | |
| Liberal Democrats | John Lutton | 305 | 11.8 | -0.2 | |
| Majority | 489 | 18.8 | +0.3 | ||
| Turnout | 2,595 | 28.3 | -3.3 | ||
| Labour hold | Swing | ||||
Laindon Park

| Party | Candidate | Votes | % | ±% | |
|---|---|---|---|---|---|
| Conservative | Jilly Hyde | 850 | 33.3 | -11.2 | |
| Labour | Barbara Croft | 624 | 24.5 | -11.3 | |
| Independent | Victor York | 613 | 24.0 | +24.0 | |
| BNP | David King | 295 | 11.6 | -8.1 | |
| Liberal Democrats | Jon Myall | 91 | 3.6 | +3.6 | |
| Green | Annie Humphries | 77 | 3.0 | +3.0 | |
| Majority | 226 | 8.9 | +0.2 | ||
| Turnout | 2,550 | 30.8 | -0.7 | ||
| Conservative gain from Labour | Swing | ||||
Lee Chapel North

| Party | Candidate | Votes | % | ±% | |
|---|---|---|---|---|---|
| Labour | Richard Rackham | 875 | 39.5 | -0.2 | |
| Conservative | Peter Morris | 627 | 28.3 | +4.3 | |
| BNP | Jay Slaven | 361 | 16.3 | -5.7 | |
| Liberal Democrats | Steve Nice | 218 | 9.8 | +1.5 | |
| Green | Ernest Humphries | 134 | 6.0 | +0.0 | |
| Majority | 248 | 11.2 | -4.5 | ||
| Turnout | 2,215 | 25.4 | -4.6 | ||
| Labour hold | Swing | ||||
Nethermayne

| Party | Candidate | Votes | % | ±% | |
|---|---|---|---|---|---|
| Liberal Democrats | Ben Williams | 1,451 | 51.0 | +9.0 | |
| Conservative | Steve Foster | 874 | 30.7 | -3.3 | |
| Labour | Julian Ware-Lane | 520 | 18.3 | -5.7 | |
| Majority | 577 | 20.3 | +12.3 | ||
| Turnout | 2,845 | 33.0 | -2.0 | ||
| Liberal Democrats hold | Swing | ||||
Pitsea North West

| Party | Candidate | Votes | % | ±% | |
|---|---|---|---|---|---|
| Labour | Keith Bobbin | 734 | 34.3 | -4.3 | |
| Conservative | Mark Coxshall | 714 | 33.4 | -11.0 | |
| BNP | Geoffrey McCarthy | 362 | 16.9 | +16.9 | |
| UKIP | Terry McBride | 167 | 7.8 | +7.8 | |
| Liberal Democrats | Martin Howard | 162 | 7.6 | -9.4 | |
| Majority | 20 | 0.9 | |||
| Turnout | 2,139 | 23.2 | -2.0 | ||
| Labour hold | Swing | ||||
Pitsea South East

| Party | Candidate | Votes | % | ±% | |
|---|---|---|---|---|---|
| Conservative | Maureen Larkin | 1,151 | 46.7 | -12.4 | |
| Labour | Emma Collins | 767 | 31.1 | -9.8 | |
| BNP | Sidney Chaney | 375 | 15.2 | +15.2 | |
| UKIP | Imelda Clancy | 174 | 7.1 | +7.1 | |
| Majority | 384 | 15.6 | -2.5 | ||
| Turnout | 2,467 | 28.4 | -2.4 | ||
| Conservative hold | Swing | ||||
St Martin's

| Party | Candidate | Votes | % | ±% | |
|---|---|---|---|---|---|
| Labour | Patricia Rackley | 625 | 41.3 | +4.7 | |
| Conservative | James Devlin | 346 | 22.9 | -0.5 | |
| BNP | Philip Howell | 325 | 21.5 | -5.3 | |
| Liberal Democrats | Mike Dickinson | 161 | 10.6 | -2.6 | |
| UKIP | Terry Wood | 56 | 3.7 | +3.7 | |
| Majority | 279 | 18.4 | +8.6 | ||
| Turnout | 1,513 | 26.6 | -1.3 | ||
| Labour hold | Swing | ||||
Vange

| Party | Candidate | Votes | % | ±% | |
|---|---|---|---|---|---|
| Labour | Danny Nandanwar | 704 | 38.7 | +3.4 | |
| Conservative | Luke MacKenzie | 636 | 34.9 | +5.9 | |
| BNP | Rodney Leveridge | 481 | 26.4 | +3.7 | |
| Majority | 68 | 3.7 | -2.7 | ||
| Turnout | 1,821 | 27.9 | +1.4 | ||
| Labour hold | Swing | ||||
Wickford Castledon

| Party | Candidate | Votes | % | ±% | |
|---|---|---|---|---|---|
| Conservative | Sylvia Buckley | 1,058 | 47.3 | -8.9 | |
| Independent | Alan Ball | 677 | 30.3 | +6.2 | |
| BNP | Anthony Gladwin | 272 | 12.2 | +12.2 | |
| Labour | Leonard Wilkins | 229 | 10.2 | -1.5 | |
| Majority | 381 | 17.0 | -15.1 | ||
| Turnout | 2,236 | 36.9 | -1.1 | ||
| Conservative hold | Swing | ||||
Wickford North

| Party | Candidate | Votes | % | ±% | |
|---|---|---|---|---|---|
| Conservative | Michael Mowe | 1,592 | 52.7 | -23.9 | |
| Independent | David Harrison | 1,021 | 33.8 | +33.8 | |
| Labour | Christopher Wilson | 409 | 13.5 | -9.9 | |
| Majority | 571 | 18.9 | -34.4 | ||
| Turnout | 3,022 | 32.6 | -1.4 | ||
| Conservative hold | Swing | ||||
Wickford Park

| Party | Candidate | Votes | % | ±% | |
|---|---|---|---|---|---|
| Conservative | Christopher Jackman | 1,096 | 64.7 | -3.7 | |
| Independent | Derek Paffett | 350 | 20.6 | +20.6 | |
| Labour | Anthony Borlase | 249 | 14.7 | +1.4 | |
| Majority | 746 | 44.0 | -6.1 | ||
| Turnout | 1,695 | 24.9 | -2.8 | ||
| Conservative hold | Swing | ||||
References
- ↑ "Council compositions by year". The Elections Centre.
- ↑ "Local Election Summaries 2007". The Elections Centre.
- ↑ "English local elections 2007". BBC News.
- ↑ "Basildon". BBC News Online. Retrieved 30 June 2011.
- ↑ "Local and Mayoral elections 2007" (PDF). House of Commons Library. 19 July 2007. Retrieved 1 July 2011.
- 1 2 3 4 Coates, Sam (9 April 2007). "Tory candidate accused of echoing the BNP message". The Times. Retrieved 1 July 2011.
- ↑ Austin, Jon (6 April 2007). "BNP candidates will outnumber Lib Dems". Southend Standard. Retrieved 1 July 2011.
- ↑ Austin, Jon (11 April 2007). "Race-hate row over election leaflet". Southend Standard. Retrieved 1 July 2011.
- ↑ "Councillor, 18, 'youngest in UK'". BBC News Online. 4 May 2007. Retrieved 1 July 2011.
- 1 2 3 4 Austin, Jon (4 May 2007). "Tories fail to make clean sweep". Southend Standard. Retrieved 1 July 2011.
- 1 2 3 4 5 6 7 8 9 10 11 12 13 14 15 "District Council election". Basildon District Council. Archived from the original on 4 June 2012. Retrieved 30 June 2011.