| Carlow–Kildare | |
|---|---|
| Former Dáil constituency | |
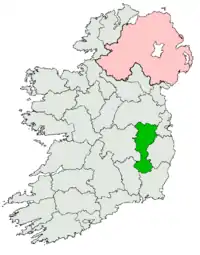 Location of Carlow–Kildare within Ireland | |
| Former constituency | |
| Created | 1937 |
| Abolished | 1948 |
| Seats | 4 |
| Local government areas | |
| Created from | |
| Replaced by | |
Carlow–Kildare was a parliamentary constituency represented in Dáil Éireann, the lower house of the Irish parliament or Oireachtas from 1937 to 1948. The constituency elected 4 deputies (Teachtaí Dála, commonly known as TDs) to the Dáil, on the system of proportional representation by means of the single transferable vote (PR-STV).
History
The constituency was created for the 1937 general election under the Electoral (Revision of Constituencies) Act 1935, replacing the old Carlow–Kilkenny and Kildare constituencies.[1]
Under the Electoral (Amendment) Act 1947, the constituency was abolished, and the Carlow–Kilkenny and Kildare constituencies were re-created for the 1948 general election.[2]
Boundaries
The constituency covered all of County Kildare, and most of County Carlow.[1] Carlow–Kildare's boundaries were defined by the 1935 Act as:
- "The administrative County of Kildare.
- The administrative County of Carlow except the portion thereof which is comprised in the County Constituencies of Wicklow and Wexford."[1]
The Act defines the parts of Carlow in the Wicklow constituency as:
- "The district electoral divisions of:
- Clonmore, Hacketstown, Haroldstown, Kineagh, Rahill, Rathvilly, Tiknock and Williamstown in the administrative County of Carlow."[1]
The parts of Carlow in the Wexford constituency are defined as:
- "The district electoral divisions of:
- Ballyellin, Ballymurphy, Borris, Coonogue, Corries, Glynn, Killedmond, Kyle, Marley, Rathanna, Sliguff and Tinnahinch in the administrative County of Carlow."[1]
TDs
| Teachtaí Dála (TDs) for Carlow–Kildare 1937–1948[3] | |||||||||
|---|---|---|---|---|---|---|---|---|---|
Key to parties
| |||||||||
| Dáil | Election | Deputy (Party) | Deputy (Party) | Deputy (Party) | Deputy (Party) | ||||
| 9th | 1937[4] | William Norton (Lab) |
Thomas Harris (FF) |
Francis Humphreys (FF) |
Sydney Minch (FG) | ||||
| 10th | 1938[5] | James Hughes (FG) | |||||||
| 11th | 1943[6] | ||||||||
| 12th | 1944[7] | ||||||||
| 13th | 1948 | Constituency abolished. See Carlow–Kilkenny and Kildare | |||||||
Note: The columns in this table are used only for presentational purposes, and no significance should be attached to the order of columns. For details of the order in which seats were won at each election, see the detailed results of that election.
Elections
1944 general election
| Party | Candidate | FPv% | Count | ||||
|---|---|---|---|---|---|---|---|
| 1 | 2 | 3 | 4 | ||||
| Fianna Fáil | Thomas Harris | 26.3 | 8,797 | ||||
| Fine Gael | James Hughes | 19.8 | 6,638 | 6,750 | |||
| Labour | William Norton | 18.3 | 6,142 | 6,287 | 6,429 | 6,598 | |
| Fianna Fáil | Francis Humphreys | 13.0 | 4,357 | 5,433 | 7,627 | ||
| Labour | Thomas Hayden | 9.2 | 3,096 | 3,200 | 3,238 | 3,444 | |
| Fine Gael | Patrick Frayne | 7.8 | 2,598 | 2,633 | 2,660 | 2,707 | |
| Fianna Fáil | Thomas Mullins | 5.6 | 1,875 | 2,499 | |||
| Electorate: 51,949 Valid: 33,503 Quota: 6,701 Turnout: 64.5% | |||||||
1943 general election
| Party | Candidate | FPv% | Count | |||||||
|---|---|---|---|---|---|---|---|---|---|---|
| 1 | 2 | 3 | 4 | 5 | 6 | 7 | ||||
| Labour | William Norton | 22.5 | 8,355 | |||||||
| Fianna Fáil | Thomas Harris | 22.2 | 8,229 | |||||||
| Fine Gael | James Hughes | 16.5 | 6,107 | 6,142 | 6,175 | 6,214 | 8,487 | |||
| Fianna Fáil | Francis Humphreys | 10.2 | 3,804 | 3,836 | 4,323 | 5,354 | 5,408 | 5,445 | 6,053 | |
| Labour | Thomas Hayden | 9.6 | 3,571 | 4,279 | 4,347 | 4,398 | 4,524 | 4,661 | 5,328 | |
| Independent | Thomas Lawlor | 8.1 | 3,007 | 3,077 | 3,124 | 3,196 | 3,562 | 4,452 | ||
| Fine Gael | Gerard Sweetman | 7.9 | 2,924 | 2,981 | 2,992 | 3,016 | ||||
| Fianna Fáil | Thomas Mullins | 3.0 | 1,117 | 1,147 | 1,307 | |||||
| Electorate: 51,949 Valid: 37,114 Quota: 7,423 Turnout: 71.4% | ||||||||||
1938 general election
| Party | Candidate | FPv% | Count | |||||
|---|---|---|---|---|---|---|---|---|
| 1 | 2 | 3 | 4 | 5 | ||||
| Fianna Fáil | Thomas Harris | 22.0 | 7,874 | |||||
| Labour | William Norton | 20.8 | 7,467 | |||||
| Fine Gael | James Hughes | 17.0 | 6,104 | 6,223 | 6,692 | 6,769 | 6,837 | |
| Fine Gael | Sydney Minch | 16.0 | 5,749 | 6,033 | 6,272 | 6,496 | 6,633 | |
| Fianna Fáil | Francis Humphreys | 15.8 | 5,645 | 7,860 | ||||
| Fianna Fáil | William Tynan | 8.3 | 2,988 | |||||
| Electorate: 48,552 Valid: 35,827 Quota: 7,166 Turnout: 73.8% | ||||||||
1937 general election
| Party | Candidate | FPv% | Count | ||||||
|---|---|---|---|---|---|---|---|---|---|
| 1 | 2 | 3 | 4 | 5 | 6 | ||||
| Labour | William Norton | 26.0 | 9,427 | ||||||
| Fine Gael | Sydney Minch | 16.5 | 5,957 | 6,413 | 7,901 | ||||
| Fianna Fáil | Francis Humphreys | 15.2 | 5,515 | 5,952 | 6,087 | 6,105 | 6,839 | 8,816 | |
| Fianna Fáil | Thomas Harris | 14.3 | 5,163 | 5,570 | 5,661 | 5,663 | 9,237 | ||
| Fianna Fáil | Brigid Darby | 11.1 | 4,021 | 4,691 | 4,799 | 4,803 | |||
| Fine Gael | Gerard Sweetman | 8.5 | 3,073 | 3,215 | 4,330 | 4,967 | 5,049 | 5,069 | |
| Fine Gael | Patrick Nolan | 8.4 | 3,041 | 3,116 | |||||
| Electorate: 48,536 Valid: 36,197 Quota: 7,240 Turnout: 74.6% | |||||||||
See also
References
- 1 2 3 4 5 "Electoral (Revision of Constituencies) Act, 1935: First Schedule (Revised constituencies)". Irish Statute Book database. Retrieved 12 February 2009.
- ↑ "Electoral (Amendment) Act, 1947: First Schedule (Constituencies)". Irish Statute Book database. Retrieved 13 September 2010.
- ↑ Walker, Brian M, ed. (1992). Parliamentary election results in Ireland, 1918–92. Dublin: Royal Irish Academy. ISBN 0-901714-96-8. ISSN 0332-0286.
- 1 2 "General election 1937: Carlow–Kildare". ElectionsIreland.org. Retrieved 13 September 2010.
- 1 2 "General election 1938: Carlow–Kildare". ElectionsIreland.org. Retrieved 13 September 2010.
- 1 2 "General election 1943: Carlow–Kildare". ElectionsIreland.org. Retrieved 13 September 2010.
- 1 2 "General election 1944: Carlow–Kildare". ElectionsIreland.org. Retrieved 13 September 2010.
- 1 2 3 4 Gallagher, Michael (1993). Irish Elections 1922–44: Results and Analysis. PSAI Press. ISBN 0951974815.