| |||||||||||||||||||||||||||||
All 45 seats in the Northampton Borough Council 23 seats needed for a majority | |||||||||||||||||||||||||||||
|---|---|---|---|---|---|---|---|---|---|---|---|---|---|---|---|---|---|---|---|---|---|---|---|---|---|---|---|---|---|
| |||||||||||||||||||||||||||||
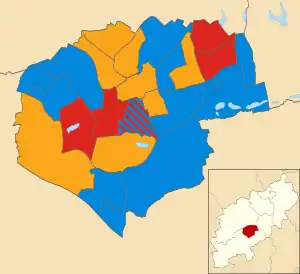 Map showing the results of the 2003 Northampton Borough Council elections. | |||||||||||||||||||||||||||||
| |||||||||||||||||||||||||||||
Elections to Northampton Borough Council were held on 1 May 2003. The whole council was up for election and the Labour Party lost overall control of the council to no overall control.
Election result
| Party | Seats | Gains | Losses | Net gain/loss | Seats % | Votes % | Votes | +/− | |
|---|---|---|---|---|---|---|---|---|---|
| Conservative | 19 | +11 | 40.4 | 37.2 | 33,122 | ||||
| Liberal Democrats | 17 | +5 | 36.2 | 35.0 | 31,199 | ||||
| Labour | 11 | -15 | 23.4 | 25.6 | 22,764 | ||||
| Independent | 0 | -1 | 0 | 1.0 | 902 | ||||
| Green | 0 | 0 | 0 | 1.0 | 864 | ||||
| UKIP | 0 | 0 | 0 | 0.2 | 143 | ||||
| Liberated Party | 0 | 0 | 0 | 0.1 | 54 | ||||
Ward results
| Party | Candidate | Votes | % | ±% | |
|---|---|---|---|---|---|
| Liberal Democrats | Irene Markham | 986 | |||
| Liberal Democrats | Brian Hoare | 893 | |||
| Labour | Trevor Owen | 578 | |||
| Labour | Vivienne Dams | 573 | |||
| Conservative | Juliette Ashby | 446 | |||
| Conservative | Barry Stoker | 414 | |||
| Turnout | 3,890 | 31.6 | |||
| Party | Candidate | Votes | % | ±% | |
|---|---|---|---|---|---|
| Conservative | David Palethorpe | 832 | |||
| Conservative | Christopher Malpas | 786 | |||
| Labour | Jean Lineker | 601 | |||
| Labour | Trevor Balley | 558 | |||
| Liberal Democrats | Norma Felstead | 283 | |||
| Liberal Democrats | Richard Baldwin | 275 | |||
| Turnout | 3,335 | 28.20 | |||
| Party | Candidate | Votes | % | ±% | |
|---|---|---|---|---|---|
| Liberal Democrats | John Yates | 1,647 | |||
| Liberal Democrats | David Perkins | 1,579 | |||
| Liberal Democrats | Maria-Trinidad Crake | 1,533 | |||
| Conservative | Alan Beal | 700 | |||
| Conservative | Julie Rolfe | 663 | |||
| Conservative | Paul Rolfe | 643 | |||
| Labour | Graham Mason | 533 | |||
| Labour | Arthur Whitford | 513 | |||
| Labour | Frances Wire | 448 | |||
| Turnout | 8,260 | 34.2 | |||
| Party | Candidate | Votes | % | ±% | |
|---|---|---|---|---|---|
| Labour | Lee Barron | 626 | |||
| Labour | Peter Evans | 558 | |||
| Conservative | Edward Barham | 474 | |||
| Conservative | Robert Butler | 452 | |||
| Liberal Democrats | Lesley Coles | 422 | |||
| Liberal Democrats | Grant Walsh | 385 | |||
| Turnout | 2,943 | 22.4 | |||
| Party | Candidate | Votes | % | ±% | |
|---|---|---|---|---|---|
| Liberal Democrats | Brendan Glynane | 1,145 | |||
| Liberal Democrats | Michelle Hoare | 1,031 | |||
| Labour | Charman Kalyan | 505 | |||
| Labour | Ulric Gravesande | 494 | |||
| Conservative | Thomas Joyner | 431 | |||
| Conservative | Michael Lobban | 398 | |||
| Turnout | 4,004 | 32.8 | |||
| Party | Candidate | Votes | % | ±% | |
|---|---|---|---|---|---|
| Conservative | Judith Lill | 1,149 | |||
| Conservative | Philip Larratt | 967 | |||
| Liberal Democrats | Jill Panebianco | 321 | |||
| Liberal Democrats | Carl Squires | 307 | |||
| Labour | Anthony Peach | 274 | |||
| Labour | David Thorn | 229 | |||
| Turnout | 3,247 | 25.2 | |||
| Party | Candidate | Votes | % | ±% | |
|---|---|---|---|---|---|
| Conservative | David Acock | 684 | |||
| Conservative | James Robinson | 625 | |||
| Labour | Debra Boss | 580 | |||
| Labour | Frank Gear | 543 | |||
| Liberal Democrats | Brian Dee | 472 | |||
| Liberal Democrats | Andrew Cheyne | 405 | |||
| Independent | Benjamin Jacobs | 258 | |||
| Green | Joan Lochmuller | 142 | |||
| Turnout | 3,709 | 30.0 | |||
| Party | Candidate | Votes | % | ±% | |
|---|---|---|---|---|---|
| Conservative | Jamie Lane | 647 | |||
| Conservative | Mohammed Yousuf Miah | 575 | |||
| Labour | Idris Davies | 400 | |||
| Labour | Mary Davies | 395 | |||
| Liberal Democrats | Leslie Felstead | 302 | |||
| Liberal Democrats | Kevin Alderton | 274 | |||
| Turnout | 2,593 | 25.1 | |||
| Party | Candidate | Votes | % | ±% | |
|---|---|---|---|---|---|
| Liberal Democrats | Charles Markham | 1,425 | |||
| Liberal Democrats | Marlon Allen-Minney | 1,389 | |||
| Conservative | Graham Hawker | 731 | |||
| Conservative | Philip West | 686 | |||
| Labour | Pamela Dixon | 442 | |||
| Labour | Timothy Hart | 414 | |||
| Turnout | 5,087 | 40.8 | |||
| Party | Candidate | Votes | % | ±% | |
|---|---|---|---|---|---|
| Liberal Democrats | Marianne Taylor | 1,356 | |||
| Liberal Democrats | Andrew Simpson | 1,340 | |||
| Labour | Dennis Hilliard | 498 | |||
| Labour | Anthea Mitchell | 446 | |||
| Conservative | Richard Booker | 441 | |||
| Conservative | Gary Austin | 441 | |||
| Green | Anthony Upton | 194 | |||
| Turnout | 4,716 | 34.1 | |||
| Party | Candidate | Votes | % | ±% | |
|---|---|---|---|---|---|
| Liberal Democrats | Sally Beardsworth | 1,523 | |||
| Liberal Democrats | Richard Church | 1,444 | |||
| Conservative | Laurice Percival | 367 | |||
| Conservative | Alan Tebbutt | 333 | |||
| Labour | Philippa Smith | 232 | |||
| Labour | Tadzio Dobraszcyk | 226 | |||
| Turnout | 4,125 | 37.0 | |||
| Party | Candidate | Votes | % | ±% | |
|---|---|---|---|---|---|
| Labour | Lee Mason | 524 | |||
| Labour | Margaret Pritchard | 523 | |||
| Conservative | Dominick Browne | 398 | |||
| Conservative | Barbara Douglas | 379 | |||
| Liberal Democrats | David Lovesy | 294 | |||
| Liberal Democrats | Philip Oakman | 266 | |||
| Turnout | 2,375 | 21.2 | |||
| Party | Candidate | Votes | % | ±% | |
|---|---|---|---|---|---|
| Conservative | Michael Hill | 1,397 | |||
| Conservative | Colin Lill | 1,394 | |||
| Labour | Michael Jones | 495 | |||
| Labour | Ruqla Sansom | 438 | |||
| Liberal Democrats | Matthew Nobles | 396 | |||
| Liberal Democrats | Suzanne Battison | 383 | |||
| Green | Evelyn Lander | 180 | |||
| Turnout | 4,683 | 33.3 | |||
| Party | Candidate | Votes | % | ±% | |
|---|---|---|---|---|---|
| Conservative | John Caswell | 1,178 | |||
| Conservative | Stephen Stewart | 1,163 | |||
| Labour | John Jelley | 695 | |||
| Labour | Francis Lilley | 583 | |||
| Independent | David Huffadine-Smith | 386 | |||
| Liberal Democrats | Philippa Swain | 267 | |||
| Liberal Democrats | Martin Taylor | 214 | |||
| Turnout | 4,486 | 36.2 | |||
| Party | Candidate | Votes | % | ±% | |
|---|---|---|---|---|---|
| Conservative | Elizabeth Tavener | 1,300 | |||
| Conservative | Donald Edwards | 1,282 | |||
| Labour | Patricia Ford | 714 | |||
| Labour | Alan Kingston | 700 | |||
| Liberal Democrats | Graham Lewis | 336 | |||
| Liberal Democrats | David Garfirth | 328 | |||
| Turnout | 4,660 | 38.5 | |||
| Party | Candidate | Votes | % | ±% | |
|---|---|---|---|---|---|
| Conservative | William Massey | 1,187 | |||
| Conservative | Brandon Eldred | 1,110 | |||
| Labour | Kenneth Dowsett | 622 | |||
| Labour | Iftikhar Choudary | 528 | |||
| Liberal Democrats | Michael Beardsworth | 420 | |||
| Liberal Democrats | Sheila Edwards | 393 | |||
| Green | Anthony Lochmuller | 141 | |||
| Turnout | 4,401 | 38.5 | |||
| Party | Candidate | Votes | % | ±% | |
|---|---|---|---|---|---|
| Labour | Paul Concannon | 628 | |||
| Labour | Anjona Roy | 567 | |||
| Conservative | Christopher Kelly | 448 | |||
| Conservative | Peter Jones | 415 | |||
| Liberal Democrats | Shane Crick | 369 | |||
| Liberal Democrats | Katharine Abu | 319 | |||
| Turnout | 2,746 | 23.2 | |||
| Party | Candidate | Votes | % | ±% | |
|---|---|---|---|---|---|
| Labour | Arthur McCutcheon | 506 | |||
| Conservative | Penelope Flavell | 492 | |||
| Conservative | Lee Dorey | 485 | |||
| Labour | Winstone Strachan | 457 | |||
| Liberal Democrats | Harry Bowden | 288 | |||
| Liberal Democrats | Russell Ellis | 270 | |||
| Green | Carol Alexander | 207 | |||
| Liberated Party | Tina Harvey | 54 | |||
| Turnout | 2,759 | 21.8 | |||
| Party | Candidate | Votes | % | ±% | |
|---|---|---|---|---|---|
| Liberal Democrats | Jane Hollis | 585 | |||
| Liberal Democrats | Anthony Woods | 522 | |||
| Labour | John Gardner | 442 | |||
| Labour | Nova Keown | 395 | |||
| Conservative | John A Cartwright | 166 | |||
| Conservative | John G Cartwright | 163 | |||
| Independent | Raoul Perry | 146 | |||
| Independent | Peter Robinson | 112 | |||
| UKIP | Michael Papworth | 70 | |||
| Turnout | 2,601 | 24.1 | |||
| Party | Candidate | Votes | % | ±% | |
|---|---|---|---|---|---|
| Labour | Leslie Marriott | 686 | |||
| Labour | Terence Wire | 670 | |||
| Conservative | Ian McCann | 668 | |||
| Conservative | Angela Wright | 590 | |||
| Liberal Democrats | Ian Vaughan | 438 | |||
| Liberal Democrats | Cecilie Wayman | 414 | |||
| Turnout | 3,466 | 28.5 | |||
| Party | Candidate | Votes | % | ±% | |
|---|---|---|---|---|---|
| Labour | Leslie Patterson | 454 | |||
| Labour | Michael Boss | 444 | |||
| Conservative | Maureen Hill | 286 | |||
| Conservative | Jonathan Nunn | 265 | |||
| Liberal Democrats | Eva Down | 257 | |||
| Liberal Democrats | Gerald Lamb | 254 | |||
| Turnout | 1,960 | 20.6 | |||
| Party | Candidate | Votes | % | ±% | |
|---|---|---|---|---|---|
| Liberal Democrats | Jill Hope | 1,225 | |||
| Liberal Democrats | Richard Matthews | 1,182 | |||
| Conservative | Rodney Sellers | 604 | |||
| Conservative | Barry Dearsley | 595 | |||
| Labour | Ghulam Chowdhury | 150 | |||
| Labour | Simon Draper | 124 | |||
| UKIP | Derek Clark | 73 | |||
| Turnout | 3,953 | 37.9 | |||
| Party | Candidate | Votes | % | ±% | |
|---|---|---|---|---|---|
| Conservative | Timothy Hadland | 1,660 | |||
| Conservative | Jane Duncan | 1,612 | |||
| Liberal Democrats | David Garlick | 548 | |||
| Liberal Democrats | James Cramp | 494 | |||
| Labour | Clare Pike | 393 | |||
| Labour | Anthony Deasy | 360 | |||
| Turnout | 5,067 | 38.5 | |||
External links
| North Northamptonshire Council | |
|---|---|
| West Northamptonshire Council | |
| Northamptonshire County Council | |
| Corby Borough Council | |
| Daventry District Council | |
| East Northamptonshire District Council | |
| Kettering Borough Council | |
| Northampton Borough Council | |
| South Northamptonshire District Council |
|
| Wellingborough Borough Council | |
| |
This article is issued from Wikipedia. The text is licensed under Creative Commons - Attribution - Sharealike. Additional terms may apply for the media files.