| ||||||||||||||||||||||||||
| Turnout | 66.8% | |||||||||||||||||||||||||
|---|---|---|---|---|---|---|---|---|---|---|---|---|---|---|---|---|---|---|---|---|---|---|---|---|---|---|
| ||||||||||||||||||||||||||
| ||||||||||||||||||||||||||
| ||||||||||||||||||||||||||
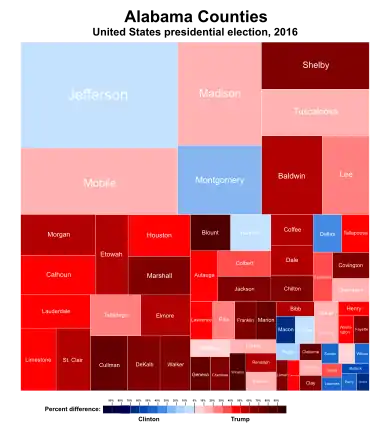
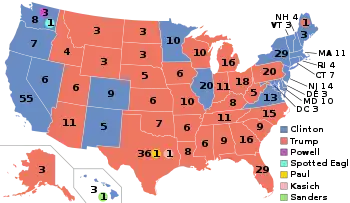
The 2016 United States presidential election in Alabama was held on Tuesday, November 8, 2016, as part of the 2016 United States presidential election in which all 50 states plus the District of Columbia participated. Alabama voters chose electors to represent them in the Electoral College via a popular vote, pitting the Republican Party's nominee, businessman Donald Trump, and running mate Indiana Governor Mike Pence against Democratic Party nominee, former Secretary of State Hillary Clinton, and her running mate Virginia Senator Tim Kaine. Alabama has nine electoral votes in the Electoral College.[2]
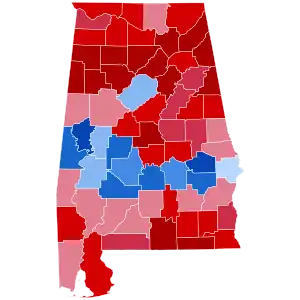
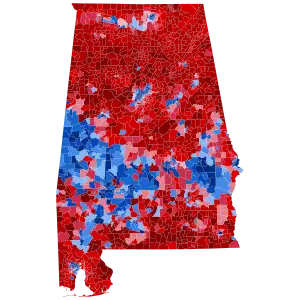
Alabama has voted for the Republican candidate in every election since it was won by Ronald Reagan in 1980. As such, Trump was heavily favored to win the state. On the day of the election, Trump won the election in Alabama with 62.08% of the vote, while Clinton received 34.36% of the vote.[3] The state had given 60.55% of its votes to Republican nominee Mitt Romney in 2012, meaning that it had shifted 1.53% more Republican from the previous election. Trump's margin of victory in Alabama was 27.72%, a 5.53% increase from Romney's 22.19% margin of victory. This makes it the largest loss by a Democrat since Democratic nominee George McGovern in 1972. On the other hand, Trump became the first Republican to win the White House without carrying Jefferson County since Richard Nixon in 1968, and Clinton the first Democrat since Adlai Stevenson II in 1952 to carry the county without winning the White House.
Primary elections
Democratic primary
Opinion polling
Results
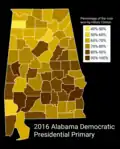
| Candidate | Popular vote (March 1 primary) |
Estimated delegates | |||
|---|---|---|---|---|---|
| Count | Percentage | Pledged | Unpledged | Total | |
| Hillary Clinton (campaign) | 309,928 | 77.84% | 44 | 6 | 50 |
| Bernie Sanders (campaign) | 76,399 | 19.19% | 9 | 0 | 9 |
| Martin O'Malley (campaign) (withdrawn) | 1,485 | 0.37% | |||
| Rocky De La Fuente (campaign) | 811 | 0.20% | |||
| Uncommitted | 9,534 | 2.39% | 0 | 1 | 1 |
| Total | 398,157 | 100% | 53 | 7 | 60 |
| Sources: The Green Papers , Alabama Democratic Party certified Election Results as received by Secretary of State of Alabama | |||||
Republican primary
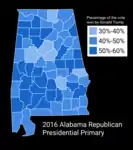
| Candidate | Votes | Percentage | Actual delegate count | ||
|---|---|---|---|---|---|
| Bound | Unbound | Total | |||
| Donald Trump | 373,721 | 43.42% | 36 | 0 | 36 |
| Ted Cruz | 181,479 | 21.09% | 13 | 0 | 13 |
| Marco Rubio | 160,606 | 18.66% | 1 | 0 | 1 |
| Ben Carson | 88,094 | 10.24% | 0 | 0 | 0 |
| John Kasich | 38,119 | 4.43% | 0 | 0 | 0 |
| Uncommitted | 7,953 | 0.92% | 0 | 0 | 0 |
| Jeb Bush (withdrawn) | 3,974 | 0.46% | 0 | 0 | 0 |
| Mike Huckabee (withdrawn) | 2,539 | 0.30% | 0 | 0 | 0 |
| Rand Paul (withdrawn) | 1,895 | 0.22% | 0 | 0 | 0 |
| Chris Christie (withdrawn) | 858 | 0.10% | 0 | 0 | 0 |
| Rick Santorum (withdrawn) | 617 | 0.07% | 0 | 0 | 0 |
| Carly Fiorina (withdrawn) | 544 | 0.06% | 0 | 0 | 0 |
| Lindsey Graham (withdrawn) | 253 | 0.03% | 0 | 0 | 0 |
| Unprojected delegates: | 0 | 0 | 0 | ||
| Total: | 860,652 | 100.00% | 50 | 0 | 50 |
| Source: The Green Papers | |||||
General election
Predictions
The following are final 2016 predictions from various organizations for Alabama as of Election Day.
| Source | Ranking | As of |
|---|---|---|
| Los Angeles Times[4] | Safe R | November 6, 2016 |
| CNN[5] | Safe R | November 8, 2016 |
| Rothenberg Political Report[6] | Safe R | November 7, 2016 |
| Sabato's Crystal Ball[7] | Safe R | November 7, 2016 |
| NBC[8] | Likely R | November 7, 2016 |
| RealClearPolitics[9] | Safe R | November 8, 2016 |
| Fox News[10] | Safe R | November 7, 2016 |
| ABC[11] | Safe R | November 7, 2016 |
Statewide results
Chart of popular vote
| Party | Candidate | Votes | % | ±% | |
|---|---|---|---|---|---|
| Republican | Donald Trump | 1,318,255 | 62.08% | +1.53% | |
| Democratic | Hillary Clinton | 729,547 | 34.36% | −4.00% | |
| Independent | Gary Johnson | 44,467 | 2.09% | +1.50% | |
| Independent | Jill Stein | 9,391 | 0.44% | +0.28% | |
| Write-in | 21,712 | 1.02% | N/A | ||
| Total votes | 2,123,372 | 100.00% | −9.37% | ||
Results by county
| County | Donald Trump Republican |
Hillary Clinton Democratic |
Various candidates Other parties |
Margin | Total | ||||
|---|---|---|---|---|---|---|---|---|---|
| # | % | # | % | # | % | # | % | ||
| Autauga | 18,172 | 72.77% | 5,936 | 23.77% | 865 | 3.46% | 12,236 | 49.00% | 24,973 |
| Baldwin | 72,883 | 76.55% | 18,458 | 19.39% | 3,874 | 4.06% | 54,425 | 57.16% | 95,215 |
| Barbour | 5,454 | 52.10% | 4,871 | 46.53% | 144 | 1.37% | 583 | 5.57% | 10,469 |
| Bibb | 6,738 | 76.40% | 1,874 | 21.25% | 207 | 2.35% | 4,864 | 55.15% | 8,819 |
| Blount | 22,859 | 89.33% | 2,156 | 8.43% | 573 | 2.24% | 20,703 | 80.90% | 25,588 |
| Bullock | 1,140 | 24.20% | 3,530 | 74.95% | 40 | 0.85% | -2,390 | -50.75% | 4,710 |
| Butler | 4,901 | 56.13% | 3,726 | 42.67% | 105 | 1.20% | 1,175 | 13.46% | 8,732 |
| Calhoun | 32,865 | 68.66% | 13,242 | 27.67% | 1,757 | 3.67% | 19,623 | 40.99% | 47,864 |
| Chambers | 7,843 | 56.42% | 5,784 | 41.61% | 273 | 1.97% | 2,059 | 14.81% | 13,900 |
| Cherokee | 8,953 | 83.42% | 1,547 | 14.41% | 233 | 2.17% | 7,406 | 69.01% | 10,733 |
| Chilton | 15,081 | 82.10% | 2,911 | 15.85% | 377 | 2.05% | 12,170 | 66.25% | 18,369 |
| Choctaw | 4,106 | 56.31% | 3,109 | 42.64% | 77 | 1.05% | 997 | 13.67% | 7,292 |
| Clarke | 7,140 | 54.79% | 5,749 | 44.12% | 142 | 1.09% | 1,391 | 10.67% | 13,031 |
| Clay | 5,245 | 79.18% | 1,237 | 18.67% | 142 | 2.15% | 4,008 | 60.51% | 6,624 |
| Cleburne | 5,764 | 87.43% | 684 | 10.37% | 145 | 2.20% | 5,080 | 77.06% | 6,593 |
| Coffee | 15,875 | 76.44% | 4,221 | 20.33% | 671 | 3.23% | 11,654 | 56.11% | 20,767 |
| Colbert | 16,746 | 67.21% | 7,312 | 29.35% | 857 | 3.44% | 9,434 | 37.86% | 24,915 |
| Conecuh | 3,420 | 51.94% | 3,080 | 46.77% | 85 | 1.29% | 340 | 5.17% | 6,585 |
| Coosa | 3,381 | 64.38% | 1,782 | 33.93% | 89 | 1.69% | 1,599 | 30.45% | 5,252 |
| Covington | 13,267 | 83.23% | 2,387 | 14.97% | 286 | 1.80% | 10,880 | 68.26% | 15,940 |
| Crenshaw | 4,513 | 72.01% | 1,664 | 26.55% | 90 | 1.44% | 2,849 | 45.46% | 6,267 |
| Cullman | 32,989 | 87.10% | 3,798 | 10.03% | 1,086 | 2.87% | 29,191 | 77.07% | 37,873 |
| Dale | 13,808 | 73.65% | 4,413 | 23.54% | 528 | 2.81% | 9,395 | 50.11% | 18,749 |
| Dallas | 5,789 | 30.81% | 12,836 | 68.31% | 167 | 0.88% | -7,047 | -37.50% | 18,792 |
| DeKalb | 21,405 | 82.88% | 3,622 | 14.02% | 799 | 3.10% | 17,783 | 68.86% | 25,826 |
| Elmore | 27,634 | 74.17% | 8,443 | 22.66% | 1,183 | 3.17% | 19,191 | 51.51% | 37,260 |
| Escambia | 9,935 | 66.92% | 4,605 | 31.02% | 305 | 2.06% | 5,330 | 35.90% | 14,845 |
| Etowah | 32,353 | 73.26% | 10,442 | 23.64% | 1,369 | 3.10% | 21,911 | 49.62% | 44,164 |
| Fayette | 6,712 | 81.37% | 1,362 | 16.51% | 175 | 2.12% | 5,350 | 64.86% | 8,249 |
| Franklin | 9,466 | 78.62% | 2,197 | 18.25% | 377 | 3.13% | 7,269 | 60.37% | 12,040 |
| Geneva | 9,994 | 85.00% | 1,525 | 12.97% | 239 | 2.03% | 8,469 | 72.03% | 11,758 |
| Greene | 838 | 17.17% | 4,013 | 82.23% | 29 | 0.60% | -3,175 | -65.06% | 4,880 |
| Hale | 3,173 | 39.47% | 4,775 | 59.39% | 92 | 1.14% | -1,602 | -19.92% | 8,040 |
| Henry | 5,632 | 69.77% | 2,292 | 28.39% | 148 | 1.84% | 3,340 | 41.38% | 8,072 |
| Houston | 30,728 | 72.07% | 10,664 | 25.01% | 1,247 | 2.92% | 20,064 | 47.06% | 42,639 |
| Jackson | 16,672 | 79.45% | 3,673 | 17.50% | 639 | 3.05% | 12,999 | 61.95% | 20,984 |
| Jefferson | 134,768 | 44.30% | 156,873 | 51.57% | 12,550 | 4.13% | -22,105 | -7.27% | 304,191 |
| Lamar | 5,823 | 83.59% | 1,036 | 14.87% | 107 | 1.54% | 4,787 | 68.72% | 6,966 |
| Lauderdale | 27,899 | 70.59% | 9,952 | 25.18% | 1,674 | 4.23% | 17,947 | 45.41% | 39,525 |
| Lawrence | 10,833 | 73.05% | 3,627 | 24.46% | 369 | 2.49% | 7,206 | 48.59% | 14,829 |
| Lee | 34,617 | 58.48% | 21,230 | 35.87% | 3,344 | 5.65% | 13,387 | 22.61% | 59,191 |
| Limestone | 29,067 | 72.14% | 9,468 | 23.50% | 1,759 | 4.36% | 19,599 | 48.64% | 40,294 |
| Lowndes | 1,751 | 26.20% | 4,883 | 73.06% | 50 | 0.74% | -3,132 | -46.86% | 6,684 |
| Macon | 1,431 | 15.66% | 7,566 | 82.78% | 143 | 1.56% | -6,135 | -67.12% | 9,140 |
| Madison | 89,520 | 54.79% | 62,822 | 38.45% | 11,047 | 6.76% | 26,698 | 16.34% | 163,389 |
| Marengo | 5,233 | 47.60% | 5,615 | 51.07% | 146 | 1.33% | -382 | -3.47% | 10,994 |
| Marion | 11,274 | 86.83% | 1,432 | 11.03% | 278 | 2.14% | 9,842 | 75.80% | 12,984 |
| Marshall | 29,233 | 82.78% | 4,917 | 13.92% | 1,166 | 3.30% | 24,316 | 68.86% | 35,316 |
| Mobile | 95,116 | 55.06% | 72,186 | 41.79% | 5,435 | 3.15% | 22,930 | 13.27% | 172,737 |
| Monroe | 5,795 | 56.42% | 4,332 | 42.18% | 144 | 1.40% | 1,463 | 14.24% | 10,271 |
| Montgomery | 34,003 | 35.46% | 58,916 | 61.45% | 2,959 | 3.09% | -24,913 | -25.99% | 95,878 |
| Morgan | 37,486 | 74.02% | 11,254 | 22.22% | 1,904 | 3.76% | 26,232 | 51.80% | 50,644 |
| Perry | 1,407 | 26.66% | 3,824 | 72.45% | 47 | 0.89% | -2,417 | -45.79% | 5,278 |
| Pickens | 5,456 | 57.18% | 3,972 | 41.63% | 114 | 1.19% | 1,484 | 15.55% | 9,542 |
| Pike | 7,693 | 58.42% | 5,056 | 38.40% | 419 | 3.18% | 2,637 | 20.02% | 13,168 |
| Randolph | 7,705 | 75.64% | 2,291 | 22.49% | 191 | 1.87% | 5,414 | 53.15% | 10,187 |
| Russell | 9,210 | 47.83% | 9,579 | 49.75% | 467 | 2.42% | -369 | -1.92% | 19,256 |
| Shelby | 73,020 | 72.12% | 22,977 | 22.69% | 5,257 | 5.19% | 50,043 | 49.43% | 101,254 |
| St. Clair | 31,651 | 82.42% | 5,589 | 14.55% | 1,160 | 3.03% | 26,062 | 67.87% | 38,400 |
| Sumter | 1,581 | 24.66% | 4,746 | 74.03% | 84 | 1.31% | -3,165 | -49.37% | 6,411 |
| Talladega | 20,614 | 61.71% | 12,121 | 36.28% | 672 | 2.01% | 8,493 | 25.43% | 33,407 |
| Tallapoosa | 13,594 | 69.76% | 5,519 | 28.32% | 373 | 1.92% | 8,075 | 41.44% | 19,486 |
| Tuscaloosa | 47,723 | 57.71% | 31,762 | 38.41% | 3,215 | 3.88% | 15,961 | 19.30% | 82,700 |
| Walker | 24,266 | 82.34% | 4,497 | 15.26% | 709 | 2.40% | 19,769 | 67.08% | 29,472 |
| Washington | 6,042 | 70.81% | 2,374 | 27.82% | 117 | 1.37% | 3,668 | 42.99% | 8,533 |
| Wilcox | 1,742 | 28.45% | 4,339 | 70.86% | 42 | 0.69% | -2,597 | -42.41% | 6,123 |
| Winston | 9,228 | 89.48% | 872 | 8.46% | 213 | 2.06% | 8,356 | 81.02% | 10,313 |
| Totals | 1,318,255 | 62.08% | 729,547 | 34.36% | 75,570 | 3.56% | 588,708 | 27.72% | 2,123,372 |
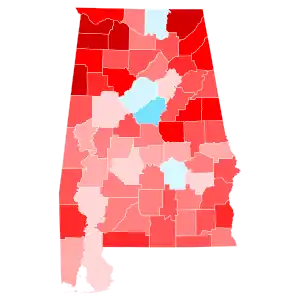
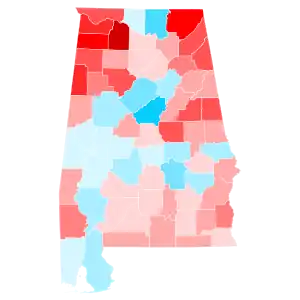
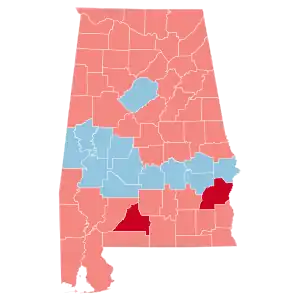
Counties that flipped from Democratic to Republican
By congressional district
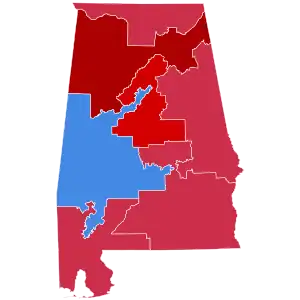
Trump won 6 of 7 congressional districts[12]
| District | Trump | Clinton | Representative |
|---|---|---|---|
| 1st | 63.5% | 34.1% | Bradley Byrne |
| 2nd | 64.9% | 33.0% | Martha Roby |
| 3rd | 65.3% | 32.3% | Mike Rogers |
| 4th | 80.4% | 17.4% | Robert Aderholt |
| 5th | 64.7% | 31.3% | Mo Brooks |
| 6th | 70.8% | 26.1% | Gary Palmer |
| 7th | 28.6% | 69.8% | Terri Sewell |
Turnout
According to the Alabama Secretary of State website, voter turnout was 66.82% with 2,137,482 ballots cast out of 3,198,703 registered voters.[1] [13]
Opinion polls
Electors
Alabama had 9 electors in 2016 all of them voted for Donald Trump for president and Mike Pence for vice president.
The electors were:
- Frank Burt Jr.
- Will Sellers
- James Eldon Wilson
- Tim Wadsworth
- J. Elbert Peters
- Mary Sue McClurkin
- Robert A. Cusanelli
- Perry O. Hooper Jr.
- Grady H. Thornton
See also
| Elections in Alabama |
|---|
 |
|
|
References
- 1 2 3 Merrill, John H. (November 29, 2016). "Official Canvas of Results" (PDF). AlabamaVotes.gov. Alabama Secretary of State. Retrieved February 16, 2017.
- ↑ "Distribution of Electoral Votes". National Archives and Records Administration. September 19, 2019. Retrieved November 23, 2020.
- ↑ "Alabama Election Results 2016 – The New York Times". Retrieved November 10, 2016.
- ↑ "Our final map has Clinton winning with 352 electoral votes. Compare your picks with ours". Los Angeles Times. November 6, 2016. Retrieved November 13, 2016.
- ↑ "Road to 270: CNN's general election map - CNNPolitics.com". Cnn.com. November 8, 2016. Retrieved November 13, 2016.
- ↑ "Presidential Ratings". The Rothenberg Political Report. Retrieved August 16, 2021.
- ↑ "Larry J. Sabato's Crystal Ball » 2016 President". Centerforpolitics.org. November 7, 2016. Retrieved November 13, 2016.
- ↑ Todd, Chuck. "NBC's Final Battleground Map Shows Clinton With a Significant Lead". NBC News. Retrieved November 13, 2016.
- ↑ "2016 Election Maps - Battle for White House". RealClearPolitics. Retrieved November 13, 2016.
- ↑ "Electoral Scorecard: Map shifts again in Trump's favor, as Clinton holds edge". Fox News. November 7, 2016. Retrieved November 13, 2016.
- ↑ "The Final 15: The Latest Polls in the Swing States That Will Decide the Election". Abcnews.go.com. November 7, 2016. Retrieved November 13, 2016.
- ↑ "Presidential Results by Congressional District, 2000-2008 – Swing State Project".
- ↑ https://www.sos.alabama.gov/sites/default/files/voter-pdfs/turnout.pdf Page 8 Last edited 2018-6-25 Retrieved 2020-07-08
.jpg.webp)

