| |||||||||||||||||||||||||||||||||
| |||||||||||||||||||||||||||||||||
| |||||||||||||||||||||||||||||||||
| |||||||||||||||||||||||||||||||||
| Elections in Connecticut |
|---|
 |
The 1992 United States presidential election in Connecticut took place on November 3, 1992, as part of the 1992 United States presidential election. Voters chose eight representatives, or electors to the Electoral College, who voted for president and vice president.
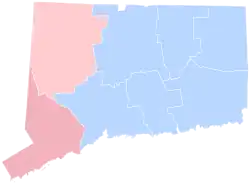
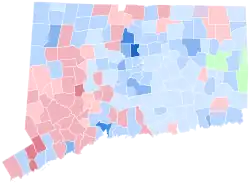
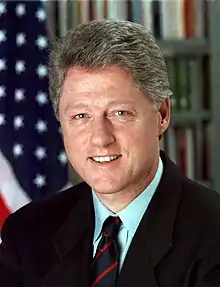
Connecticut was won by Governor Bill Clinton (D-Arkansas) with 42.21% of the popular vote over incumbent President George H. W. Bush (R-Texas) with 35.78%. Businessman Ross Perot (I-Texas) finished in third, with 21.58% of the popular vote. Clinton won Connecticut by a margin of 6.43%, marking the first time the state voted for a Democratic presidential nominee since 1968. It would be the last time Connecticut was regarded as a swing state, as it has voted Democratic by double digits in every election since.[1] Clinton ultimately won the national vote, defeating incumbent President Bush.[2] As of the 2020 presidential election, this is the last election in which Fairfield County voted for the Republican candidate. This is also the most recent occasion that Connecticut voted to the right of the following states: Arkansas, Michigan, Minnesota, Missouri, New Mexico, Oregon, Pennsylvania, and West Virginia.
As of 2023, this was the most recent presidential election in which the Republican nominee carried the city of Danbury and the towns of Fairfield, Milford, North Canaan, Old Saybrook, Pomfret, Stratford, and Weston. This was also the first time since 1912 that the towns of Washington and Canaan voted Democratic. This is also the only time since 1889 that a Democrat won the presidency without winning the city of Derby.[lower-alpha 1]
Results
| 1992 United States presidential election in Connecticut[1] | |||||
|---|---|---|---|---|---|
| Party | Candidate | Votes | Percentage | Electoral votes | |
| Democratic | Bill Clinton | 682,318 | 42.21% | 8 | |
| Republican | George H. W. Bush (incumbent) | 578,313 | 35.78% | 0 | |
| Independent | Ross Perot | 348,771 | 21.58% | 0 | |
| Libertarian | Andre Marrou | 5,391 | 0.33% | 0 | |
| New Alliance | Lenora Fulani | 1,363 | 0.08% | 0 | |
| N/A | Other | 176 | 0.01% | 0 | |
| Totals | 1,616,332 | 100.0% | 8 | ||
| Voter Turnout (Voting age/Registered) | 64%/82% | ||||
By county
| County[3] | Clinton% | Clinton# | Bush% | Bush# | Others% | Others# |
|---|---|---|---|---|---|---|
| Fairfield | 39.1% | 160,202 | 42.8% | 175,158 | 18.1% | 74,050 |
| Hartford | 47.1% | 195,495 | 32.0% | 132,591 | 20.9% | 86,718 |
| Litchfield | 36.1% | 33,686 | 37.0% | 34,492 | 26.9% | 25,035 |
| Middlesex | 42.8% | 34,707 | 30.4% | 24,646 | 26.7% | 21,674 |
| New Haven | 41.9% | 161,374 | 36.7% | 141,264 | 21.4% | 82,494 |
| New London | 42.3% | 49,808 | 29.4% | 34,567 | 28.4% | 33,392 |
| Tolland | 41.4% | 27,425 | 31.2% | 20,632 | 27.4% | 18,158 |
| Windham | 40.4% | 19,621 | 30.8% | 14,963 | 28.8% | 14,004 |
Counties that flipped from Republican to Democratic
See also
Notes
References
- 1 2 "1992 Presidential General Election Results - Connecticut". U.S. Election Atlas. Retrieved June 8, 2012.
- ↑ "1992 Presidential General Election Results". U.S. Election Atlas. Retrieved June 8, 2012.
- ↑ "Dave Leip's Atlas of U.S. Presidential Elections".
.jpg.webp)
