| ||||||||||||||||||||||
All 44 seats in the Derby City Council 23 seats needed for a majority | ||||||||||||||||||||||
|---|---|---|---|---|---|---|---|---|---|---|---|---|---|---|---|---|---|---|---|---|---|---|
| ||||||||||||||||||||||
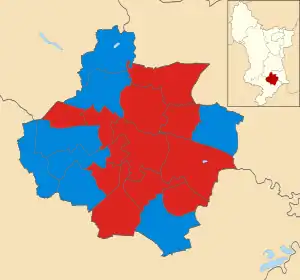 Map showing the results of the 1979 Derby City Council elections. | ||||||||||||||||||||||
| ||||||||||||||||||||||
The 1979 Derby City Council election took place on 3 May 1979 to elect members of Derby City Council in England.[3] This was on the same day as other local elections. Voting took place across 18 wards, each electing 3 Councillors. The Labour Party gained control of the council from the Conservative Party.
Overall results
| Party | Seats | Gains | Losses | Net gain/loss | Seats % | Votes % | Votes | +/− | |
|---|---|---|---|---|---|---|---|---|---|
| Labour | 26 | 59.1 | 47.1 | 53,325 | |||||
| Conservative | 18 | 40.9 | 45.2 | 51,164 | |||||
| Liberal | 0 | 0.0 | 6.4 | 7,276 | |||||
| Independent | 0 | 0.0 | 1,132 | 1.0 | New | ||||
| United English National | 0 | 0.0 | 0.2 | 244 | |||||
| Communist | 0 | 0.0 | 0.0 | 49 | New | ||||
| Total | 54 | 113,190 | |||||||
Ward results
Abbey
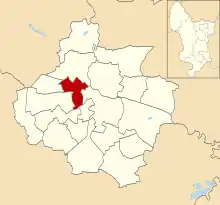
Location of Abbey ward
| Party | Candidate | Votes | % | ||
|---|---|---|---|---|---|
| Labour | F. Tunnicliffe | 3,101 | |||
| Labour | M. Walker | 2,735 | |||
| Labour | D. McNab | 2,714 | |||
| Conservative | K. Marples | 2,061 | |||
| Conservative | K. Hutchinson | 2,030 | |||
| Conservative | D. Williams | 1,937 | |||
| Independent | T. Parker | 508 | |||
| Liberal | E. Richards | 382 | |||
| Liberal | J. Titterton | 362 | |||
| Liberal | L. Wilson | 331 | |||
| Turnout | 64.3% | ||||
| Labour win (new seat) | |||||
| Labour win (new seat) | |||||
| Labour win (new seat) | |||||
Allestree

Location of Allestree ward
| Party | Candidate | Votes | % | ||
|---|---|---|---|---|---|
| Conservative | J. Thorpe | 4,302 | |||
| Conservative | B. Chadwick | 4,273 | |||
| Labour | S. Davies | 1,419 | |||
| Labour | K. Bloor | 1,384 | |||
| Liberal | W. Nuttall | 987 | |||
| Turnout | 84.0% | ||||
| Conservative win (new seat) | |||||
| Conservative win (new seat) | |||||
Alvaston

Location of Alvaston ward
| Party | Candidate | Votes | % | ||
|---|---|---|---|---|---|
| Labour | W. Baker | 2,293 | |||
| Labour | G. Sweeting | 2,061 | |||
| Conservative | B. Stafford | 1,971 | |||
| Conservative | J. McNair | 1,771 | |||
| Turnout | 70.1% | ||||
| Labour win (new seat) | |||||
| Labour win (new seat) | |||||
Babington

Location of Babington ward
| Party | Candidate | Votes | % | ||
|---|---|---|---|---|---|
| Labour | J. Maltby | 3,332 | |||
| Labour | W. Matthews | 3,268 | |||
| Labour | S. Unwin | 2,805 | |||
| Conservative | V. Flint | 1,895 | |||
| Conservative | M. Garland | 1,836 | |||
| Conservative | T. Hoogerwerf | 1,731 | |||
| Independent | K. Johal | 624 | |||
| United English National | S. Gibson | 244 | |||
| Turnout | 63.5% | ||||
| Labour win (new seat) | |||||
| Labour win (new seat) | |||||
| Labour win (new seat) | |||||
Blagreaves

Location of Blagreaves ward
| Party | Candidate | Votes | % | ||
|---|---|---|---|---|---|
| Conservative | M. Grimwood-Taylor | 3,430 | |||
| Conservative | F. Murphy | 3,276 | |||
| Labour | I. Slater | 2,410 | |||
| Labour | P. McLaverty | 2,397 | |||
| Turnout | 74.2% | ||||
| Conservative win (new seat) | |||||
| Conservative win (new seat) | |||||
Boulton

Location of Boulton ward
| Party | Candidate | Votes | % | ||
|---|---|---|---|---|---|
| Labour | A. Kennedy | 3,321 | |||
| Labour | C. Perkins | 3,267 | |||
| Conservative | W. Hughes | 2,615 | |||
| Conservative | H. Mrozek | 2,424 | |||
| Turnout | 74.6% | ||||
| Labour win (new seat) | |||||
| Labour win (new seat) | |||||
Breadsall

Location of Breadsall ward
| Party | Candidate | Votes | % | ||
|---|---|---|---|---|---|
| Labour | E. Ward | 3,980 | |||
| Labour | M. Wawman | 3,790 | |||
| Conservative | S. Nicols | 2,478 | |||
| Conservative | E. Wood | 2,354 | |||
| Turnout | 69.9% | ||||
| Labour win (new seat) | |||||
| Labour win (new seat) | |||||
Chaddesden

Location of Chaddesden ward
| Party | Candidate | Votes | % | ||
|---|---|---|---|---|---|
| Labour | F. Brocklehurst | 3,285 | |||
| Labour | G. Summers | 3,245 | |||
| Conservative | G. Andrews | 3,075 | |||
| Conservative | H. Sephton | 2,775 | |||
| Turnout | 72.1% | ||||
| Labour win (new seat) | |||||
| Labour win (new seat) | |||||
Chellaston
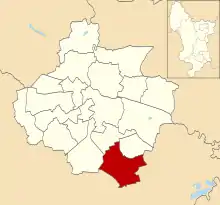
Location of Chellaston ward
| Party | Candidate | Votes | % | ||
|---|---|---|---|---|---|
| Conservative | A. Bussell | 2,786 | |||
| Conservative | J. Blount | 2,646 | |||
| Labour | M. Fuller | 2,569 | |||
| Labour | J. Moseley | 2,369 | |||
| Turnout | 77.1% | ||||
| Conservative win (new seat) | |||||
| Conservative win (new seat) | |||||
Darley

Location of Darley ward
| Party | Candidate | Votes | % | ||
|---|---|---|---|---|---|
| Conservative | E. Reid | 4,376 | |||
| Conservative | J. Tillett | 4,322 | |||
| Conservative | R. Longdon | 4,162 | |||
| Labour | T. Wilson | 2,155 | |||
| Labour | J. Dolan | 2,152 | |||
| Labour | G. Bolton | 2,099 | |||
| Turnout | 69.3% | ||||
| Conservative win (new seat) | |||||
| Conservative win (new seat) | |||||
| Conservative win (new seat) | |||||
Derwent

Location of Derwent ward
| Party | Candidate | Votes | % | ||
|---|---|---|---|---|---|
| Labour | G. Topham | 2,975 | |||
| Labour | L. Topham | 2,693 | |||
| Conservative | B. Daniels | 1,510 | |||
| Conservative | E. Kitchen | 1,436 | |||
| Liberal | S. Connolly | 735 | |||
| Liberal | S. Cudworth | 593 | |||
| Communist | B. Birks | 49 | |||
| Turnout | 65.6% | ||||
| Labour win (new seat) | |||||
| Labour win (new seat) | |||||
Kingsway

Location of Kingsway ward
| Party | Candidate | Votes | % | ||
|---|---|---|---|---|---|
| Conservative | H. Johnson | 2,820 | |||
| Conservative | J. Bates | 2,712 | |||
| Labour | E. Jones | 1,495 | |||
| Labour | J. Anderson | 1,391 | |||
| Liberal | B. Benson | 1,355 | |||
| Liberal | A. Spendlove | 1,306 | |||
| Turnout | 70.9% | ||||
| Conservative win (new seat) | |||||
| Conservative win (new seat) | |||||
Litchurch

Location of Litchurch ward
| Party | Candidate | Votes | % | ||
|---|---|---|---|---|---|
| Labour | R. Newton | 3,611 | |||
| Labour | M. Wood | 3,333 | |||
| Conservative | A. Northover | 1,377 | |||
| Conservative | R. Hyde | 1,363 | |||
| Turnout | 52.4% | ||||
| Labour win (new seat) | |||||
| Labour win (new seat) | |||||
Littleover

Location of Littleover ward
| Party | Candidate | Votes | % | ||
|---|---|---|---|---|---|
| Conservative | R. Wood | 3,453 | |||
| Conservative | L. Shepley | 3,431 | |||
| Labour | P. Woodhead | 1,420 | |||
| Labour | R. Umney | 1,392 | |||
| Turnout | 73.1% | ||||
| Conservative win (new seat) | |||||
| Conservative win (new seat) | |||||
Mackworth
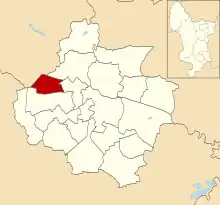
Location of Mackworth ward
| Party | Candidate | Votes | % | ||
|---|---|---|---|---|---|
| Labour | D. Robinson | 3,221 | |||
| Labour | R. Baxter | 3,182 | |||
| Conservative | R. Doubleday | 1,805 | |||
| Conservative | B. Broxholme | 1,651 | |||
| Liberal | L. Taylor | 733 | |||
| Liberal | K. Toombs | 725 | |||
| Turnout | 73.9% | ||||
| Labour win (new seat) | |||||
| Labour win (new seat) | |||||
Mickleover

Location of Mickleover ward
| Party | Candidate | Votes | % | ||
|---|---|---|---|---|---|
| Conservative | N. Glen | 2,062 | |||
| Conservative | N. Keene | 2,060 | |||
| Liberal | A. Smith | 1,839 | |||
| Liberal | E. Sharp | 1,762 | |||
| Labour | J. Ward | 1,140 | |||
| Labour | H. Gorham | 1,013 | |||
| Turnout | 78.5% | ||||
| Conservative win (new seat) | |||||
| Conservative win (new seat) | |||||
Normanton

Location of Normanton ward
| Party | Candidate | Votes | % | ||
|---|---|---|---|---|---|
| Labour | J. Godfrey | 3,148 | |||
| Labour | R. Laxton | 2,978 | |||
| Conservative | R. Andjelic | 2,124 | |||
| Conservative | R. Oldershaw | 2,048 | |||
| Turnout | 68.8% | ||||
| Labour win (new seat) | |||||
| Labour win (new seat) | |||||
Osmanton

Location of Osmaston ward
| Party | Candidate | Votes | % | ||
|---|---|---|---|---|---|
| Labour | B. Carty | 3,085 | |||
| Labour | R. Spacey | 2,789 | |||
| Conservative | A. Allen | 1,336 | |||
| Conservative | H. Parsons | 1,261 | |||
| Turnout | 62.0% | ||||
| Labour win (new seat) | |||||
| Labour win (new seat) | |||||
| Labour win (new seat) | |||||
Sinfin

Location of Sinfin ward
| Party | Candidate | Votes | % | ||
|---|---|---|---|---|---|
| Labour | E. Bull | 2,554 | |||
| Labour | N. Dhindsa | 2,150 | |||
| Conservative | J. Keith | 2,024 | |||
| Conservative | W. Swinburn | 1,902 | |||
| Turnout | 66.4% | ||||
| Labour win (new seat) | |||||
| Labour win (new seat) | |||||
Spondon

Location of Spondon ward
| Party | Candidate | Votes | % | ||
|---|---|---|---|---|---|
| Conservative | J. Scholes | 3,664 | |||
| Conservative | D. Kellogg | 3,550 | |||
| Conservative | D. Edgar | 3,498 | |||
| Labour | R. Collar | 2,811 | |||
| Labour | T. Cullerton | 2,739 | |||
| Labour | W. Pountain | 2,370 | |||
| Liberal | T. Dickenson | 1,245 | |||
| Liberal | J. Somerset-Sullivan | 735 | |||
| Turnout | 80.8% | ||||
| Conservative win (new seat) | |||||
| Conservative win (new seat) | |||||
| Conservative win (new seat) | |||||
References
- ↑ "Council compositions by year". The Elections Centre.
- ↑ "Local Election Summaries 1979". The Elections Centre.
- ↑ Rallings, Colin; Thrasher, Michael. Local Elections Handbook 1979. Plymouth University, Plymouth, UK: The Elections Centre. p. 16.
- 1 2 3 4 5 6 7 8 9 10 11 12 13 14 15 16 17 18 19 20 "Derby City Council Election Results 1979-1995" (PDF). Elections Centre.
| Metropolitan boroughs |
|
|---|---|
| District councils (England) |
|
| District councils (Wales) |
|
| Referendums | |
This article is issued from Wikipedia. The text is licensed under Creative Commons - Attribution - Sharealike. Additional terms may apply for the media files.