| |||||||||||||||||||||||||||||||||||||||||||||||||||||
17 of the 51 seats to Derby City Council 26 seats needed for a majority | |||||||||||||||||||||||||||||||||||||||||||||||||||||
|---|---|---|---|---|---|---|---|---|---|---|---|---|---|---|---|---|---|---|---|---|---|---|---|---|---|---|---|---|---|---|---|---|---|---|---|---|---|---|---|---|---|---|---|---|---|---|---|---|---|---|---|---|---|
| |||||||||||||||||||||||||||||||||||||||||||||||||||||
 Map showing the results of contested wards in the 2015 Derby City Council elections. | |||||||||||||||||||||||||||||||||||||||||||||||||||||
| |||||||||||||||||||||||||||||||||||||||||||||||||||||
The 2015 Derby City Council election took place on 7 May 2015 to elect members of the Derby City Council in England.[3] It was held on the same day as other local elections. The Labour Party increased its majority on the council by gaining two seats.
Election results
| Party | Seats | Gains | Losses | Net gain/loss | Seats % | Votes % | Votes | +/− | |
|---|---|---|---|---|---|---|---|---|---|
| Labour | 11 | 2 | 0 | 64.7 | 37.2 | 40,309 | |||
| Conservative | 5 | 0 | 0 | 29.4 | 31.2 | 33,750 | |||
| Liberal Democrats | 1 | 0 | 1 | 5.9 | 12.0 | 13,042 | |||
| UKIP | 0 | 0 | 0 | 0.0 | 16.9 | 18,293 | New | ||
| Green | 0 | 0 | 0 | 0.0 | 1.1 | 1,217 | |||
| Independent | 0 | 0 | 1 | 0.0 | 0.8 | 875 | |||
| TUSC | 0 | 0 | 0 | 0.0 | 0.6 | 643 | New | ||
| BNP | 0 | 0 | 0 | 0.0 | 0.1 | 98 | |||
| British Independents | 0 | 0 | 0 | 0.0 | 0.1 | 60 | New | ||
| English Democrat | 0 | 0 | 0 | 0.0 | 0.0 | 50 | New | ||
All comparisons in vote share are to the corresponding 2011 election.
Ward results
Abbey
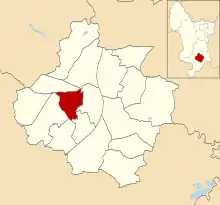
Location of Abbey ward
| Party | Candidate | Votes | % | |
|---|---|---|---|---|
| Labour | Asaf Afzal | 2,688 | 50.1% | |
| Conservative | Edward James Packham | 1,056 | 19.7% | |
| Liberal Democrats | Richard Hudson | 875 | 16.3% | |
| UKIP | Martin Ashley Bardoe | 748 | 13.9% | |
| Majority | 1,632 | 30.4% | ||
| Turnout | 5,367 | 54.8% | ||
| Labour hold | ||||
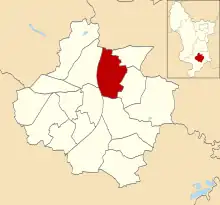
Allestree

Location of Allestree ward
| Party | Candidate | Votes | % | |
|---|---|---|---|---|
| Conservative | Steve Hassall | 4,867 | 56.7% | |
| Labour | Simon Peter Parkes | 1,835 | 21.4% | |
| UKIP | Frank Leeming | 1,005 | 11.7% | |
| Liberal Democrats | Deena Smith | 883 | 10.3% | |
| Majority | 3,032 | 35.3% | ||
| Turnout | 8,590 | 77.5% | ||
| Conservative hold | ||||
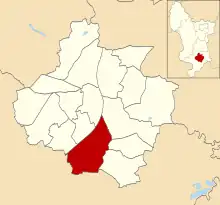
Alvaston
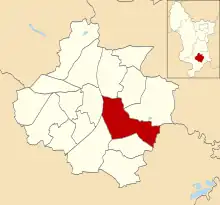
Location of Alvaston ward
| Party | Candidate | Votes | % | |
|---|---|---|---|---|
| Labour | Paul Bayliss | 2,588 | 40.8% | |
| UKIP | Arron Marsden | 1,826 | 28.8% | |
| Conservative | Pete Berry | 1,404 | 22.4% | |
| Liberal Democrats | Ellen Anthony | 385 | 6.1% | |
| TUSC | Charles Albert Taylor | 74 | 1.2% | |
| British Independents | David Andrew Gale | 60 | 0.9% | |
| Majority | 762 | 12.0% | ||
| Turnout | 6,337 | 55.9% | ||
| Labour hold | ||||
Arboretum

Location of Arboretum ward
| Party | Candidate | Votes | % | |
|---|---|---|---|---|
| Labour | Fareed Hussain | 3,549 | 71.1% | |
| Conservative | Ross McCristal | 505 | 10.1% | |
| Liberal Democrats | Margaret Hird | 434 | 8.7% | |
| UKIP | Usman Khalid-Raja | 387 | 7.8% | |
| TUSC | Graham Lewis | 118 | 2.4% | |
| Majority | 3,044 | 61.0% | ||
| Turnout | 4,993 | 46.3% | ||
| Labour hold | ||||
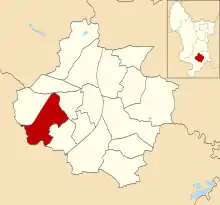
Blagreaves

Location of Blagreaves ward
| Party | Candidate | Votes | % | |
|---|---|---|---|---|
| Labour | Amo Raju | 2,401 | 36.8% | |
| Liberal Democrats | Danielle Lind | 1,990 | 30.5% | |
| Conservative | Max Craven | 1,235 | 18.9% | |
| UKIP | Vincent Davis | 844 | 12.9% | |
| Majority | 411 | 6.3% | ||
| Turnout | 6,527 | 66.0% | ||
| Labour gain from Liberal Democrats | ||||
Boulton

Location of Boulton ward
| Party | Candidate | Votes | % | |
|---|---|---|---|---|
| Labour | Barbara Sybil Jackson | 2,177 | 37.8% | |
| UKIP | Steve Fowke | 1,562 | 27.1% | |
| Conservative | Celia Ingall | 1,538 | 26.7% | |
| Green | David Leonard Foster | 239 | 4.2% | |
| Liberal Democrats | Brian Venn | 159 | 2.8% | |
| TUSC | Shaun Christopher Stuart | 80 | 1.4% | |
| Majority | 615 | 10.7% | ||
| Turnout | 5,755 | 57.8% | ||
| Labour hold | ||||
Chaddesden

Location of Chaddesten ward
| Party | Candidate | Votes | % | |
|---|---|---|---|---|
| Labour | Linda Mary Winter | 2,147 | 34.4% | |
| Conservative | Jonathan Charles Smale | 2,131 | 34.2% | |
| UKIP | Anthony Joseph Crawley | 1,558 | 25.0% | |
| Liberal Democrats | Ian Colin Care | 304 | 4.9% | |
| BNP | Paul Hillard | 98 | 1.6% | |
| Majority | 16 | 0.3% | ||
| Turnout | 6,238 | 62.0% | ||
| Labour hold | ||||
Chellaston

Location of Chellaston ward
| Party | Candidate | Votes | % | |
|---|---|---|---|---|
| Conservative | Alan Leslie Grimadell | 3,342 | 43.8% | |
| Labour | Cecile Yvonne Wright | 2,161 | 28.3% | |
| UKIP | John Evans | 1,506 | 19.7% | |
| Liberal Democrats | Jane Elizabeth Katharine Webb | 568 | 7.4% | |
| English Democrat | David William Black | 50 | 0.7% | |
| Majority | 1,181 | 15.5% | ||
| Turnout | 7,627 | 67.0% | ||
| Conservative hold | ||||
Darley

Location of Darley ward
| Party | Candidate | Votes | % | |
|---|---|---|---|---|
| Labour | Martin Jeffrey Repton | 2,698 | 39.1% | |
| Conservative | Jordan Kemp | 2,373 | 34.4% | |
| UKIP | Kirk Lewis Kus | 632 | 9.2% | |
| Green | Alice Sarah Mason-Power | 632 | 9.2% | |
| Liberal Democrats | John Allman Cameron | 565 | 8.2% | |
| Majority | 325 | 4.7% | ||
| Turnout | 6,900 | 66.4% | ||
| Labour hold | ||||
Derwent
Location of Derwent ward
| Party | Candidate | Votes | % | |
|---|---|---|---|---|
| Labour | Martin Rawson | 2,107 | 42.5% | |
| UKIP | Sarah Ann Hallam | 1,336 | 27.0% | |
| Conservative | Steve Willoughby | 1,165 | 23.5% | |
| Liberal Democrats | Simon Ferrigno | 349 | 7.0% | |
| Majority | 771 | 15.5% | ||
| Turnout | 4,957 | 51.4% | ||
| Labour hold | ||||
Littleover
Location of Littleover ward
| Party | Candidate | Votes | % | |
|---|---|---|---|---|
| Liberal Democrats | Mike Carr | 2,682 | 35.4% | |
| Labour | Dom Anderson | 2,403 | 31.7% | |
| Conservative | Gee Afsar | 1,744 | 23.0% | |
| UKIP | Vaughan Saxby | 606 | 8.0% | |
| Independent (politician) | Tony Welch | 139 | 1.8% | |
| Majority | 279 | 3.7% | ||
| Turnout | 7,574 | 71.9% | ||
| Liberal Democrats hold | ||||
Mackworth

Location of Mackworth ward
| Party | Candidate | Votes | % | |
|---|---|---|---|---|
| Labour | Diane Elizabeth Froggatt | 1,811 | 32.9% | |
| Conservative | Sean Thomas Rose | 1,268 | 23.0% | |
| UKIP | Freddie Theobald | 1,094 | 19.9% | |
| Independent | Lisa Maria Higginbottom* | 736 | 13.4% | |
| Green | Marten Kats | 346 | 6.3% | |
| Liberal Democrats | Catrin Sian Rutland | 250 | 4.5% | |
| Majority | 543 | 9.9% | ||
| Turnout | 5,505 | 57.4% | ||
| Labour gain from Independent | ||||
Note: Lisa Higginbottom was elected as a Labour councillor at the previous election in 2011, but resigned to sit as an independent in October 2013.[4]
Mickleover

Location of Mickleover ward
| Party | Candidate | Votes | % | |
|---|---|---|---|---|
| Conservative | John Keith | 3,772 | 43.9% | |
| Liberal Democrats | Peter Joseph Barker | 2,382 | 27.7% | |
| Labour | Lester John Pendrey | 1,523 | 17.7% | |
| UKIP | Ian Edward Crompton | 925 | 10.8% | |
| Majority | 1,390 | 16.2% | ||
| Turnout | 8,602 | 73.6% | ||
| Conservative hold | ||||
Normanton

Location of Normanton ward
| Party | Candidate | Votes | % | |
|---|---|---|---|---|
| Labour | Jangir Khan | 3,763 | 71.6% | |
| Conservative | Ashley Anthony Waterhouse | 597 | 11.4% | |
| UKIP | Jayprakash Joshi | 486 | 9.2% | |
| Liberal Democrats | Jill Leonard | 219 | 4.2% | |
| TUSC | Terence Anderson | 191 | 3.6% | |
| Majority | 3,166 | 60.2% | ||
| Turnout | 5,256 | 51.0% | ||
| Labour hold | ||||
Oakwood

Location of Oakwood ward
| Party | Candidate | Votes | % | |
|---|---|---|---|---|
| Conservative | Robin Wood | 3,345 | 51.0% | |
| Labour | Fay Knight | 1,672 | 25.5% | |
| UKIP | Gary John Small | 1,197 | 18.3% | |
| Liberal Democrats | Roger Anthony Jackson | 340 | 5.2% | |
| Majority | 1,673 | 25.5% | ||
| Turnout | 6,554 | 65.1% | ||
| Conservative hold | ||||
Sinfin
Location of Sinfin ward
| Party | Candidate | Votes | % | |
|---|---|---|---|---|
| Labour | Joanna Terese West | 2,993 | 60.7% | |
| UKIP | Gaurav Pandey | 1,383 | 28.0% | |
| Liberal Democrats | Jake Zyla | 432 | 8.8% | |
| TUSC | Zbigniew Wojcik | 123 | 2.5% | |
| Majority | 1,610 | 32.7% | ||
| Turnout | 6,624 | 66.5% | ||
| Labour hold | ||||
Spondon

Location of Spondon ward
| Party | Candidate | Votes | % | |
|---|---|---|---|---|
| Conservative | Nicola Angela Roulstone | 3,384 | 51.1% | |
| Labour | Richard Morgan | 1,793 | 27.1% | |
| UKIP | Garth Munton | 1,222 | 18.4% | |
| Liberal Democrats | Alf Wall | 225 | 3.4% | |
| Majority | 1,591 | 24.0% | ||
| Turnout | 6,624 | 66.5% | ||
| Conservative hold | ||||
References
- ↑ "Local Election Results 2015". Andrew Teale.
- ↑ "Local Election 2015". Derby City Council.
- ↑ "Upcoming elections & referendums". The Electoral Commission. Archived from the original on 15 March 2015. Retrieved 28 March 2015.
- ↑ Chris Mallett (22 October 2013). "Former Derby Mayor quits Labour in protest at cash cuts". Derby Telegraph. Archived from the original on 27 November 2013.
This article is issued from Wikipedia. The text is licensed under Creative Commons - Attribution - Sharealike. Additional terms may apply for the media files.