| |||||||||||||||||||||||||||||||||||||||||||||||||||||||||||||
18 out of 51 seats for the Solihull Metropolitan Borough Council 26 seats needed for a majority | |||||||||||||||||||||||||||||||||||||||||||||||||||||||||||||
|---|---|---|---|---|---|---|---|---|---|---|---|---|---|---|---|---|---|---|---|---|---|---|---|---|---|---|---|---|---|---|---|---|---|---|---|---|---|---|---|---|---|---|---|---|---|---|---|---|---|---|---|---|---|---|---|---|---|---|---|---|---|
| |||||||||||||||||||||||||||||||||||||||||||||||||||||||||||||
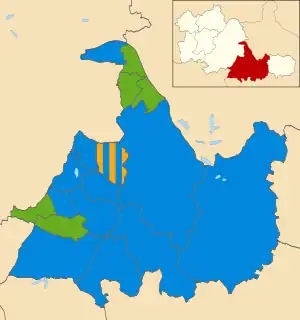 Map showing the results of the 2021 Solihull Metropolitan Borough Council election | |||||||||||||||||||||||||||||||||||||||||||||||||||||||||||||
| |||||||||||||||||||||||||||||||||||||||||||||||||||||||||||||
The 2021 Solihull Metropolitan Borough Council election took place on 6 May 2021 to elect members of Solihull Metropolitan Borough Council in England. This was on the same day as other local elections.[1] One-third of the seats were up for election.
Results
| 2021 Solihull Metropolitan Borough Council election | ||||||||||
|---|---|---|---|---|---|---|---|---|---|---|
| Party | This election | Full council | This election | |||||||
| Seats | Net | Seats % | Other | Total | Total % | Votes | Votes % | +/− | ||
| Conservative | 12 | 66.7 | 18 | 30 | 58.8 | 34,478 | 53.8 | +7.9 | ||
| Green | 5 | 27.8 | 10 | 15 | 29.4 | 13,112 | 20.5 | -5.1 | ||
| Liberal Democrats | 1 | 5.6 | 2 | 3 | 5.9 | 7,800 | 12.2 | -1.3 | ||
| Labour | 0 | 0.0 | 2 | 2 | 3.9 | 8,264 | 12.9 | +0.9 | ||
| Independent | 0 | 0.0 | 1 | 1 | 2.0 | 311 | 0.5 | -2.6 | ||
| Reform UK | 0 | 0.0 | 0 | 0 | 0.0 | 111 | 0.2 | New | ||
| The Democratic Party | 0 | 0.0 | 0 | 0 | 0.0 | 28 | <0.1 | New | ||
Ward results
Bickenhill
| Party | Candidate | Votes | % | ±% | |
|---|---|---|---|---|---|
| Conservative | Jim Ryan | 2,098 | 67.3 | +6.6 | |
| Labour | Margaret Brittin | 516 | 16.6 | -6.4 | |
| Green | Stephen Rymer | 350 | 11.2 | -5.2 | |
| Liberal Democrats | Gayle Monk | 154 | 5.0 | N/A | |
| Majority | 1,582 | 50.7 | +13.0 | ||
| Turnout | 3,118 | ||||
| Conservative hold | Swing | +6.5 | |||
Blythe
| Party | Candidate | Votes | % | ±% | |
|---|---|---|---|---|---|
| Conservative | James Butler | 2,880 | 67.6 | +16.5 | |
| Green | Rachel Douglas | 610 | 14.3 | +8.0 | |
| Labour | Martin Tolman | 558 | 13.1 | +4.1 | |
| Independent | Peter Bulcock | 212 | 5.0 | N/A | |
| Majority | 2,270 | 53.3 | +35.7 | ||
| Turnout | 4,260 | ||||
| Conservative hold | Swing | +4.3 | |||
Castle Bromwich
| Party | Candidate | Votes | % | ±% | |
|---|---|---|---|---|---|
| Conservative | Martin McCarthy | 1,652 | 50.6 | -20.6 | |
| Green | Ian Shore | 1,153 | 35.3 | +26.0 | |
| Labour | Emma Chidler | 461 | 14.1 | -3.8 | |
| Majority | 499 | 15.3 | -38.5 | ||
| Turnout | 3,266 | ||||
| Conservative hold | Swing | -23.3 | |||
Chelmsley Wood
| Party | Candidate | Votes | % | ±% | |
|---|---|---|---|---|---|
| Green | Shesh Sheshabhatter | 1,115 | 60.2 | -14.9 | |
| Conservative | James Hughes | 380 | 20.5 | +16.4 | |
| Labour | Hazel Dawkins | 328 | 17.7 | +7.5 | |
| The Democratic Party | Matthew Ward | 28 | 1.5 | N/A | |
| Majority | 735 | 39.7 | -24.9 | ||
| Turnout | 1,851 | ||||
| Green hold | Swing | -15.7 | |||
Dorridge and Hockley Heath
| Party | Candidate | Votes | % | ±% | |
|---|---|---|---|---|---|
| Conservative | Ken Meeson | 3,029 | 69.58 | ||
| Labour | David Brittin | 487 | 11.19 | ||
| Green | Iona McIntyre | 420 | 9.65 | ||
| Liberal Democrats | Paul McCabe | 306 | 7.03 | ||
| Reform UK | Scott Martin | 111 | 2.55 | N/A | |
| Majority | 2,542 | 58.40 | |||
| Turnout | 4,353 | ||||
| Conservative hold | Swing | ||||
Elmdon
| Party | Candidate | Votes | % | ±% | |
|---|---|---|---|---|---|
| Conservative | Yvonne Clements | 1,399 | 43.6 | +8.7 | |
| Liberal Democrats | Richard Long | 1,389 | 43.3 | +6.7 | |
| Conservative | Keith Green | 1,201 | |||
| Liberal Democrats | Brad Tucker | 1,179 | |||
| Labour | John Doherty | 418 | 13.0 | +2.8 | |
| Labour | Mark Szrejder | 295 | |||
| Majority | 10 | ||||
| Turnout | 3,553 | 37.47 | |||
| Conservative gain from Liberal Democrats | Swing | ||||
| Liberal Democrats hold | Swing | ||||
Kingshurst and Fordbridge
| Party | Candidate | Votes | % | ±% | |
|---|---|---|---|---|---|
| Green | Nathan Moses | 831 | 42.33 | ||
| Conservative | Alan Feeney | 689 | 35.10 | ||
| Labour | Flo Nash | 443 | 22.57 | ||
| Majority | 142 | 8.39 | |||
| Turnout | 1,963 | ||||
| Green gain from Labour | Swing | ||||
Knowle
| Party | Candidate | Votes | % | ±% | |
|---|---|---|---|---|---|
| Conservative | Dave Pinwell | 3,121 | 73.50 | ||
| Labour | Simon Johnson | 461 | 10.86 | ||
| Green | Mark Amphlett | 370 | 8.71 | ||
| Liberal Democrats | Kate Jones | 294 | 6.92 | N/A | |
| Majority | 2,660 | 62.65 | |||
| Turnout | 4,246 | ||||
| Conservative hold | Swing | ||||
Lyndon
| Party | Candidate | Votes | % | ±% | |
|---|---|---|---|---|---|
| Conservative | Josh O'Nyons | 1,684 | 44.15 | ||
| Liberal Democrats | Ade Adeyemo | 1,556 | 40.80 | ||
| Labour | Nick Stephens | 574 | 15.05 | ||
| Majority | 128 | 3.36 | |||
| Turnout | 3,814 | ||||
| Conservative gain from Liberal Democrats | Swing | ||||
Meriden
| Party | Candidate | Votes | % | ±% | |
|---|---|---|---|---|---|
| Conservative | Tony Dicicco | 2,850 | 65.88 | ||
| Green | Alison Wilson | 1,008 | 23.30 | ||
| Labour | Sam Mather | 468 | 10.82 | ||
| Majority | 1,842 | 33.58 | |||
| Turnout | 4,326 | ||||
| Conservative hold | Swing | ||||
Olton
| Party | Candidate | Votes | % | ±% | |
|---|---|---|---|---|---|
| Conservative | Daniel Gibbin | 2,148 | 47.85 | ||
| Liberal Democrats | Michael Carthew | 1,800 | 40.10 | ||
| Labour | Catherine Gulati | 541 | 12.05 | ||
| Majority | 348 | 7.75 | |||
| Turnout | 4,489 | ||||
| Conservative gain from Liberal Democrats | Swing | ||||
Shirley East
| Party | Candidate | Votes | % | ±% | |
|---|---|---|---|---|---|
| Conservative | Karen Grinsell | 1,866 | 47.23 | ||
| Green | Antony Lowe | 1,757 | 44.47 | ||
| Labour | Deon Bailey | 328 | 8.30 | ||
| Majority | 109 | 2.76 | |||
| Turnout | 3,951 | ||||
| Conservative hold | Swing | ||||
Shirley South
| Party | Candidate | Votes | % | ±% | |
|---|---|---|---|---|---|
| Green | Max McLoughlin | 2,122 | 51.05 | ||
| Conservative | Howard Nichols | 1,606 | 38.63 | ||
| Labour | Elizabeth Thacker | 330 | 7.94 | ||
| Independent | Rosemary Worsley | 99 | 2.38 | N/A | |
| Majority | 516 | 12.42 | |||
| Turnout | 4,157 | ||||
| Green hold | Swing | ||||
Shirley West
| Party | Candidate | Votes | % | ±% | |
|---|---|---|---|---|---|
| Green | Maggie Allen | 1,814 | 51.10 | ||
| Conservative | Lachhman Bhambra | 1,238 | 34.87 | ||
| Labour | Kevin Round | 498 | 14.03 | ||
| Majority | 576 | 16.23 | |||
| Turnout | 3,550 | ||||
| Green hold | Swing | ||||
Silhill
| Party | Candidate | Votes | % | ±% | |
|---|---|---|---|---|---|
| Conservative | Peter Hogarth | 2,735 | 67.23 | ||
| Labour | Janet Marsh | 757 | 18.61 | ||
| Liberal Democrats | Justin McCarthy | 576 | 14.16 | ||
| Majority | 1,978 | 48.62 | |||
| Turnout | 4,068 | ||||
| Conservative hold | Swing | ||||
Smith's Wood
| Party | Candidate | Votes | % | ±% | |
|---|---|---|---|---|---|
| Green | Jean Hamilton | 1,084 | 59.72 | ||
| Conservative | Angus Young | 441 | 24.30 | ||
| Labour | Teresa Beddis | 290 | 15.98 | ||
| Majority | 643 | 35.42 | |||
| Turnout | 1,815 | ||||
| Green hold | Swing | ||||
St Alphege
| Party | Candidate | Votes | % | ±% | |
|---|---|---|---|---|---|
| Conservative | Angela Sandison | 3,461 | 69.28 | ||
| Liberal Democrats | Frank Dawson | 546 | 10.93 | ||
| Labour | Ian English | 511 | 10.23 | ||
| Green | Trevor Barker | 478 | 9.57 | ||
| Majority | 2,915 | 58.34 | |||
| Turnout | 4,996 | ||||
| Conservative hold | Swing | ||||
References
| Birmingham | |
|---|---|
| Coventry | |
| Dudley | |
| Sandwell | |
| Solihull | |
| Walsall | |
| Wolverhampton | |
| West Midlands County Council |
|
| Mayor | |
| |
This article is issued from Wikipedia. The text is licensed under Creative Commons - Attribution - Sharealike. Additional terms may apply for the media files.