Castirla | |
|---|---|
 A general view of Castirla | |
Location of Castirla | |
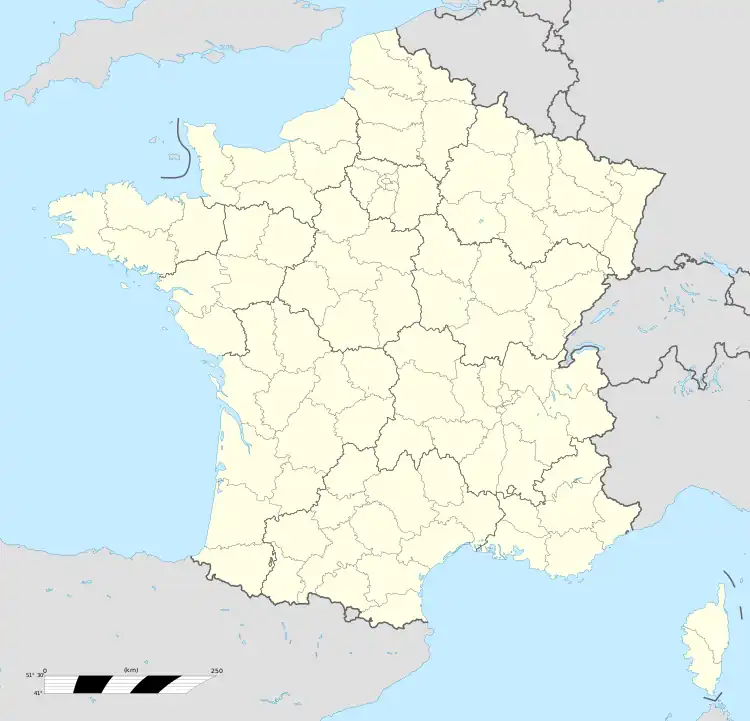 Castirla 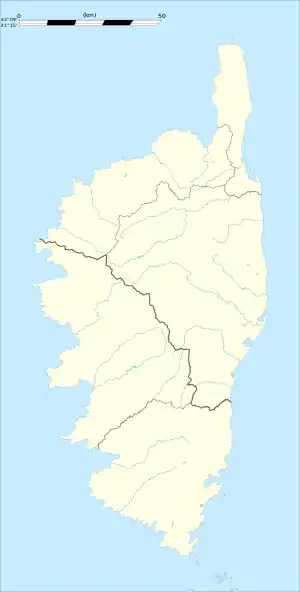 Castirla | |
| Coordinates: 42°22′24″N 9°08′41″E / 42.3733°N 9.1447°E | |
| Country | France |
| Region | Corsica |
| Department | Haute-Corse |
| Arrondissement | Corte |
| Canton | Golo-Morosaglia |
| Government | |
| • Mayor (2020–2026) | Jacques-André Tomasini[1] |
| Area 1 | 24.32 km2 (9.39 sq mi) |
| Population | 149 |
| • Density | 6.1/km2 (16/sq mi) |
| Time zone | UTC+01:00 (CET) |
| • Summer (DST) | UTC+02:00 (CEST) |
| INSEE/Postal code | 2B083 /20236 |
| Elevation | 298–1,951 m (978–6,401 ft) (avg. 450 m or 1,480 ft) |
| 1 French Land Register data, which excludes lakes, ponds, glaciers > 1 km2 (0.386 sq mi or 247 acres) and river estuaries. | |
Castirla (French pronunciation: [kastiʁla]) is a commune in the Haute-Corse department of France on the island of Corsica.
Geography
Climate
Castirla has a hot-summer mediterranean climate (Köppen climate classification Csa). The average annual temperature in Castirla is 14.5 °C (58.1 °F). The average annual rainfall is 705.0 mm (27.76 in) with December as the wettest month. The temperatures are highest on average in July, at around 24.3 °C (75.7 °F), and lowest in January, at around 5.6 °C (42.1 °F). The highest temperature ever recorded in Castirla was 42.8 °C (109.0 °F) on 19 July 2023; the coldest temperature ever recorded was −10.5 °C (13.1 °F) on 10 January 1981.
| Climate data for Castirla (1981–2010 averages, extremes 1974−present) | |||||||||||||
|---|---|---|---|---|---|---|---|---|---|---|---|---|---|
| Month | Jan | Feb | Mar | Apr | May | Jun | Jul | Aug | Sep | Oct | Nov | Dec | Year |
| Record high °C (°F) | 22.5 (72.5) |
24.0 (75.2) |
32.5 (90.5) |
30.0 (86.0) |
36.0 (96.8) |
39.5 (103.1) |
42.8 (109.0) |
41.0 (105.8) |
36.0 (96.8) |
32.0 (89.6) |
28.5 (83.3) |
21.5 (70.7) |
42.8 (109.0) |
| Mean daily maximum °C (°F) | 11.2 (52.2) |
13.5 (56.3) |
16.9 (62.4) |
19.4 (66.9) |
24.6 (76.3) |
28.9 (84.0) |
33.1 (91.6) |
32.7 (90.9) |
27.7 (81.9) |
22.5 (72.5) |
15.8 (60.4) |
11.2 (52.2) |
21.5 (70.7) |
| Daily mean °C (°F) | 5.6 (42.1) |
7.0 (44.6) |
9.9 (49.8) |
12.4 (54.3) |
17.0 (62.6) |
20.9 (69.6) |
24.3 (75.7) |
24.0 (75.2) |
19.9 (67.8) |
15.7 (60.3) |
10.1 (50.2) |
6.3 (43.3) |
14.5 (58.1) |
| Mean daily minimum °C (°F) | 0.0 (32.0) |
0.5 (32.9) |
2.9 (37.2) |
5.4 (41.7) |
9.4 (48.9) |
12.8 (55.0) |
15.5 (59.9) |
15.3 (59.5) |
12.2 (54.0) |
9.0 (48.2) |
4.4 (39.9) |
1.4 (34.5) |
7.4 (45.3) |
| Record low °C (°F) | −10.5 (13.1) |
−7.0 (19.4) |
−9.0 (15.8) |
−3.5 (25.7) |
0.5 (32.9) |
4.0 (39.2) |
6.5 (43.7) |
6.0 (42.8) |
4.0 (39.2) |
1.0 (33.8) |
−5.0 (23.0) |
−8.0 (17.6) |
−10.5 (13.1) |
| Average precipitation mm (inches) | 61.5 (2.42) |
54.9 (2.16) |
56.7 (2.23) |
74.2 (2.92) |
47.8 (1.88) |
31.7 (1.25) |
20.6 (0.81) |
27.5 (1.08) |
47.0 (1.85) |
87.2 (3.43) |
97.1 (3.82) |
98.8 (3.89) |
705.0 (27.76) |
| Average precipitation days (≥ 1.0 mm) | 7.0 | 6.6 | 6.9 | 8.3 | 5.8 | 3.8 | 2.2 | 3.1 | 5.0 | 7.4 | 9.0 | 8.9 | 73.9 |
| Source: Meteociel[3] | |||||||||||||
Population
| Year | Pop. | ±% |
|---|---|---|
| 1962 | 185 | — |
| 1968 | 185 | +0.0% |
| 1975 | 206 | +11.4% |
| 1982 | 184 | −10.7% |
| 1990 | 145 | −21.2% |
| 1999 | 186 | +28.3% |
| 2008 | 183 | −1.6% |
See also
References
- ↑ "Répertoire national des élus: les maires". data.gouv.fr, Plateforme ouverte des données publiques françaises (in French). 2 December 2020.
- ↑ "Populations légales 2021". The National Institute of Statistics and Economic Studies. 28 December 2023.
- ↑ "Normales et records pour Castirla-Usine Electricite (2B)". Meteociel. Retrieved 11 June 2022.
External links
- Personal website about Castirla, with pictures (in French)
Wikimedia Commons has media related to Castirla.
This article is issued from Wikipedia. The text is licensed under Creative Commons - Attribution - Sharealike. Additional terms may apply for the media files.