The economy of the state of Hidalgo is based on the free market, the most recent information places Hidalgo with a state Human Development Index of 0.723 Alto (2015).[2] Hidalgo's gross domestic product was 276,784 million pesos; and contributes 1.7% to the national GDP.[3][4]
Its main productive activities include commerce, the food industry, construction, transport and storage, and real estate and rental services for movable and intangible property.[5] The strategic sectors in the state are: agro-industrial, mechanical metal, tourism, construction products, renewable energy, textile and clothing, logistics, professional services, research and innovation, and information technology.[5] The State of Hidalgo is a traditional mining center, and the main products extracted from its soil are sulfur, zinc, and lead, followed by silver and gold, although the supply of these precious metals has been depleted. As for agriculture the main crops are: alfalfa, maguey, sugarcane, barley, beans, coffee; and as for fishing: carp, trout, and a small lake fish called charal.
Economic indicators
Gross domestic product
| GDP Hidalgo. Percentage share in current values (preliminary figures) | ||
|---|---|---|
| Sector of economic activity | Percentage | |
| Primary Activities | 3.67 | |
| Agriculture, animal husbandry and exploitation, forestry, fishing and hunting | 3.67 | |
| Side Activities | 41.98 | |
| mining | 1.06 | |
| Generation, transmission and distribution of electricity, water and gas supply by pipelines to the final consumer | 2.52 | |
| construction | 9.56 | |
| Manufacturing | 28.84 | |
| Tertiary activities | 54.35 | |
| commerce | 14.38 | |
| Temporary lodging and food and beverage preparation services | 1.87 | |
| Transport and Information in the Mass Media | 8.91 | |
| Financial & Real Estate Services | 13.79 | |
| Educational & Medical Services | 9.07 | |
| Government Activities | 4.52 | |
| Other services | 1.81 | |
| Source: INEGI (2015). {[6] | ||
The gross domestic product of Hidalgo amounts to 276,784 million current pesos in 2014,[3] and the GDP per capita was 97,364 current pesos.[3]
Manufacturing industries are the most important sector in Hidalgo, these industries contributed 33.3% of Hidalgo's GDP in 2003 in current pesos; This contribution decreased to 29% in 2014, due to a low real average annual growth of 0.7%, from 2003 to 2014.[7] Among the sectors that grew the most during the period are Financial and Insurance Services, and Information in the Mass Media, which presented average annual real growth rates of 13.3 and 9.4%, respectively, figures well above the 2.7% reached by the total GDP of the state in the period.[7] Tula de Allende concentrates almost half of the wealth generation in the state, contributing 0.34% of the gross domestic product (GDP) despite the fact that, according to the Mexican Business Information System (SIEM), there are very few companies in that region.[8] Tula contributes 47.6 percent of the state's gross domestic product (GDP), and Pachuca de Soto contributes 13.6 percent of the wealth, so between the two cities they concentrate more than 60 percent of the total value added in Hidalgo.[8]
GDP per capita
Hidalgo shows a constant increase in GDP per capita, with the exception of 2008 and 2009, when there was a decrease. If we consider the municipal GDP per capita, the following municipalities with the highest GDP per capita per year are: Atitalaquia, Pachuca de Soto, Tizayuca, Tulancingo de Bravo, Ixmiquilpan, Mineral de la Reforma, Atotonilco de Tula, Tepeji del Río de Ocampo, Huichapan and Tepeapulco. All of them are municipalities with a high participation of the secondary and tertiary sector; and in the central area of the state.
In contrast to the above, the municipalities with the lowest GDP per capita within the state are: Lolotla, Juárez Hidalgo, Tianguistengo, Tlahuiltepa, Xochiatipan, Metztitlan, Yahualica, San Felipe Orizatlán, Chilcuautla and Huazalingo. The characteristic of the municipalities, their economic base is based on the primary sector; second, and all of them are located in the northern part of the state.
Human Development Index
The most recent information places Hidalgo with a state Human Development Index of 0.723 High (2015); comparable to Fiji.[2] The gross domestic product of Hidalgo in 2014 represented 1.7% of the national total and compared to the previous year had an increase of 0.12%.[9]
In 2010, Mineral de la Reforma is the municipality with the highest human development in Hidalgo, with an HDI of 0.822; in contrast, the municipality with the lowest performance in the state is Tepehuacán de Guerrero, whose HDI is 0.537.[10] The development gap between the two municipalities is 34.6%.[10]
If the performance of the municipalities with the highest and lowest development is compared, it is possible to recognize that in Hidalgo there are development conditions similar to those of Barbados and Lao People's Democratic Republic.[11]
|
| ||||||||||||||||||||||||||||||||||||||||||||||||||||||||||||||||||||||||||||||||||||||||||||||||
.png.webp)
Muy alto (0.696214 - 0.917404)
Alto (0.644856 - 0696213)
Medio (0.590097 - 0.644855)
Bajo (0.361848 - 0.590096)
Economically active population and employed personnel
As of the third quarter of 2016, the Economically Active Population (EAP) amounted to 1,230,173 people, of whom 61.7% are men and 38.3% are women;[12] In total, the EAP represented 57.64% of the working-age population.[12] Of the total EAP, 97.33% is occupied and 2.67% is unoccupied.[12] Of the total, 798,603 are salaried, 290,541 are self-employed, 48,304 are employers, and 59,909 are unpaid.[12]
In 2013, the total number of people employed was 353,978;[13] of these, 50.4% corresponded to paid employed personnel; 37.5% to owners, family members and other workers, who collaborated for the economic unit without receiving remuneration and 12.1% were made up of personnel not dependent on the company name.[13] For the total employed personnel, 33.1% were concentrated in Commerce, 32.4% in Non-Financial Private Services and 25.7% in Manufacturing.[14]
Poverty and social marginalization
| Percentage and number of people by poverty indicator. | ||
|---|---|---|
| Indicator | Population | Percentage of population |
| Moderate poverty | 1 197 356 | 42.0% |
| Extreme poverty | 350 456 | 12.3% |
| Vulnerable due to social deprivation | 735 629 | 25.8% |
| Income Vulnerable | 145 501 | 5.1% |
| Not poor and not vulnerable | 421 354 | 14.8% |
| Unspecified | 8063 | |
| Source: Estimates by the CONEVAL, 2014.[15] | ||
According to the National Council for the Evaluation of Social Development Policy in 2014, 54.3% of the total population lived in poverty, of which 42.0% were in moderate poverty and 12.3% were in extreme poverty.[16] According to measurements, in 2008 55.0% of the population was in poverty, by 2010 it decreased to 54.8%, by 2012 it decreased to 52.8% and by 2014 the percentage increased again to 54.3%.[16][17] The municipalities with the highest percentage of their population living in poverty were: Yahualica, Xochiatipan, Tepehuacán de Guerrero, Huehuetla and Calnali.[17] The municipalities with the lowest percentage of their population living in extreme poverty were: Mineral de la Reforma, Pachuca de Soto, Tizayuca, Atotonilco de Tula and Tepeji del Río de Ocampo.[17] On the other hand, those with the highest concentration of people in poverty were: Pachuca de Soto, Huejutla de Reyes, Tulancingo de Bravo, Ixmiquilpan, Tula de Allende.[17]
The municipalities with the highest percentage of the population living in extreme poverty were: Xochiatipan, Yahualica, Huehuetla, Tepehuacán de Guerrero and San Felipe Orizatlán.[17] The municipalities with the lowest percentage of their population living in extreme poverty were: Mineral de la Reforma, Pachuca de Soto, Tizayuca, Atotonilco de Tula and Tepeapulco.[17]
19.1% of the population is behind in education; 17.3% lack access to health services; 68.9% lack access to social security;[15]% have lack of access to housing; 27.0% lack basic services in their homes and 31.7% lack access to food.[15]
The five municipalities with the highest degree of marginalization in the state are: Huehuetla, Yahualica and Xochiatipan.[18] The five municipalities with the lowest degree of marginalization in the state are: Pachuca de Soto, Mineral de la Reforma, Tepeapulco, Tizayuca and Atitalaquia.[19]
Sectors of economic activity
Primary activities
They are classified as primary: agriculture, livestock, forestry, fishing, etc. The territory of Hidalgo has an area of 2.1 million hectares, of which 29% are used for agriculture, 39% for livestock, 22% are forest areas, 9% correspond to urban areas, roads, facilities, etc. and only 1% is occupied by bodies of water.[20]
Agriculture
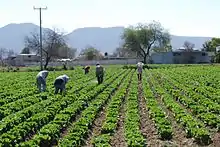
The agricultural area planted in 2013 was 576,907 hectares, of which 146,428 hectares were irrigated (25.4%) and 430,479 hectares were rainfed (74.6%).[21] Of the seventy-six crops planted in the state, the main ones in account of planted area were: corn (44%); barley (19%); alfalfa (8%); bean (6%); fodder oats (5%); cherry coffee (4%) and pastures (4%), which together account for 91% of the total area.[22]
The production volume of 7 557 117 tonnes, in turn, 5 732 467 tonnes were produced in irrigation (75.9%) and 1 824 650 tonnes in rainfed (24.1 %).[21] The main crops in terms of production are: alfalfa (58%), pastures (12%), corn (9%), forage oats (7%), maguey (6%), and barley (2%) that add up to 93% of the state's production.[21] The value of production amounted to 8,015,293,000 pesos, 4,018,827,000 pesos (50.1%) in irrigation, and 3,996,466,000 pesos (49.9%) in rainfall. [22]
The irrigated area is 154 000 ha, comprising 90 000 hectares of the Irrigation Districts and the rest corresponding to the 646 Irrigation Units, located mainly in the Tulancingo and Tecozautla Valleys.[20] 66% of the irrigated area is located in the Rural Development District of Mixquiahuala; 13.83% in the Rural Development District of Huichapan; 9.6% in the Rural Development District of Tulancingo and the remaining 10.57% is distributed in the Rural Development Districts of Huejutla, Zacualtipán and Pachuca.[20] The largest agricultural area is the one bathed by the Tula River. The production of non-traditional crops for the production of innovative products such as: preparations based on amaranth, xoconostle and maguey honey.[23]
Hidalgo is the first place in the country in the production of grain barley, coriander seed, pulquero maguey, lion's hand and forage turnip;[21] in second place of national production are green alfalfa, alstroemeria (coarse), peas, pomegranate, cloud and Zempoaxochitl.[22] In third place: canola, green fodder barley, green beans and figs; in fourth place nationally: olives, oats, grain oats, sugar cane other uses, peas, cauliflower, beans and prickly pears; and finally in fifth place: artichoke, raspberry and radish.[22]
On the other hand, the production of the production chain prickly pear-prickly pear, the production chain apple, the citrus production chain and the coffee production chain stand out for their importance.[22]
.jpg.webp)
Ranching
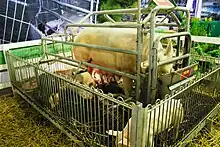
The volume of livestock production during the year 2013 was 545,000 of which 109,732 tons was carcass meat, highlighting the production of sheep. The value of livestock production amounted to 8,015 million pesos. The value of livestock production amounted to 8015 million pesos. Its main products are classified into three categories: meat in channel with a share of 20.6%, milk 78.0% and other products 1.4%.
In turn, those that stood out the most were milk from bovine with 78%, carcass meat from poultry 10.8%, meat in bovine carcass 5.9%, carcass meat pork 2.2% and carcass meat sheep 1.4%, which together represent 98.2% % of state livestock production.[24]
Hidalgo has a wide tradition borreguera concentrated in the regions of Apan, Tulancingo de Bravo, Tizayuca, Actopan and Ixmiquilpan.[20] There are seven slaughterhouses and nineteen slaughterhouses, which have coverage in twenty-eight municipalities of the state, with fifty-six municipalities without a registered establishment.
The products that stand out in their production at the national level are: 2nd place in Meat in the Sheep Canal, 9th place in bovine milk, 6th place in meat in the Guajolote Canal, 15th place in Meat in the Canal of poultry and bee honey.
Fishing and aquaculture
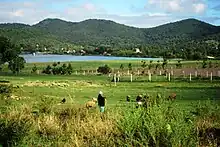
Aquaculture production in the state has gained relevance in recent years, the consolidation of the trout and tilapia production chains; During the 2013 cycle there was a production volume of 8,000 tons with a production value of 193.5 million pesos.
The volume of fishing production in Hidalgo is 8,000 tons, ranking 2nd nationally in fishing production in states without coastline.[25] The main species are: carp with 55.6% participation in production, mojarra 39.1% and trout 3.7%, which represent 98.4% of production state.[25]
It is a state with important fishing and aquaculture activities; produces annually: 3531.3 tons with a value of 52.2 million pesos. The main species caught are mojarra, tilapia, carpa, trout and charal.[23]
The majority of fishing production in the state is reported without an official record, because the vast majority is destined for self-consumption, there are not enough organized groups and, consequently, there is no National Fisheries Registry.[20]
Forestry
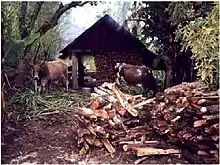
In Hidalgo there is a wooded area of cold climate temperate forest where timber species such as pine, oyamel, white cedar and oak are used, the former belonging to the group of the confieras, and the latter to the arborio group of the broad-leaved trees.[26] The forest area of the state is 817 640 ha, of which 454 486 are forest, 252 036 are arid zones and 13 184 are other formations.[27][28] Forestry contributed just under 1% of the state's GDP.[20]
In Hidalgo, the forest area corresponds to a wooded area of forests of cold climate temperate where timber species such as pine, oyamel, white cedar and oak are used, the former belonging to the group of conifers, and the latter to the arboreal group of broadleaf.[29] According to the State's forest inventory, the land susceptible to reforestation can reach up to 743,224 hectares, of which only 2500 are reforested on an annual average, despite having an infrastructure for the production of plants from more than 60 nurseries in dependencies, communities and municipalities, this is due to the fact that reforestation programs are generally short-term. with limited social participation, insufficient resources and technological obsolescence and in work processes, from the collection of germplasm to the evaluation of reforestation.
Forestry activity in the State contributed just under 1% of GDP.[20] Timber forest production in 2009 was 110,000 cubic meters in rolls, with a value of 107.5 million pesos.[20] The process of deforestation goes beyond the reforestation actions carried out by the various agencies, organizations and the social sector.[20]
In 1997, only 28 000 hectares were exploited, representing 12 per cent of the previous area, in other words there is a potential of 88 per cent of this area that can later be incorporated into commercial exploitation.[29] Of these 28,000 hectares, 63 percent correspond to ejidos of the entity and the remaining 27 percent to small property, that is, most of the forest resources are located on communal property areas and are therefore exploited jointly by the inhabitants of said ejido, the rest of the forest area is used by small owners.[29]
Secondary activities
This sector refers to industrial activities, those that transform the resources of the primary sector. Considering the number of companies installed in the state, the sectors with the greatest participation in the industry are: textile, metalmechanical, automotive, construction , food, furniture, jewelry, leather, footwear, chemical and plastic.[30]
Mining

Mining is one of the oldest activities, with a long tradition in the state.[31][32] Mining in the state of Hidalgo accounts for 1.06% of the state's GDP.[33] About 75.4% of the value of mining production corresponds to non-metallic minerals, highlighting gravel, sand and limestone.[33]
Approximately forty-five mines are mined in the state;[34] the municipalities of Tula de Allende, Francisco I. Madero and Zimapán, are producers of limestone deposits, they also produce stone aggregates such as gravel, sand and road seals, and produce raw materials for the production of lime and cement.[35] In Huichapan, Tecozautla and Chapantongo, there are quarry deposits for the construction industry.[35] In Zimapán there are deposits of calcium carbonate.[31] In the municipalities of Agua Blanca de Iturbide and Metepec has deposits of kaolin, an input in the production of the cement industry.[31] Tepehuacán de Guerrero has one of the largest veins of manganese.[35]
The Pachuca-Real del Monte Mining District is located north of the Mexico Basin, in the Sierra de Pachuca, in the metallogenetic province called Neovolcanic Axis, which explains the presence of polymetallic deposits of silver, lead, zinc, copper and gold. This district is divided into two areas: Pachuca and Real del Monte.[36]
The mining district of Zimapán is located in the western portion of the state of Hidalgo.[37] This district is made up of a considerable number of mining works that include mines, shafts, levels, shafts, among others, where the Las Ánimas and Lomo de Toro mines have been the most relevant.[37] The morphology of the mineral bodies of the Zimapán mining district is represented by mantles, chimneys and disseminations in both the intrusive and the skarn.[37]
The Molango mining district is located in the northeastern portion of Hidalgo, approximately 260 km northeast of Mexico City, covering an area of approximately 1250 km2.[37] The deposit is divided into two parts, to the north Tetzintla, with a mineralogy composed of: manganocalcite, kutnahorite, rhodochrosite, and calcite with accessory minerals of clay, quartz, pyrite, magnetite, and plianite. In the southern part of the site (Nonoalco) the mineralogy is composed of nsutite with small amounts of psilomelane, pyrolusite, cryptomelane and hausmanite.[37]
| Mineral | Year 2003[38] | Year 2004[39] | Year 2005[40] | Year 2006[41] | Year 2007[42] |
|---|---|---|---|---|---|
| Gold | 79.1 | 43.8 | 41.6 | 7.1 | 11.5 |
| Silver | 25 360 | 17 448 | 17 448 | 30 582 | 15 614 |
| Lead | 1057 | 1057 | 1331 | —— | 4428 |
| Copper | 118 | 118 | 254 | 1,068 | 1,437 |
| Zinc | 4775 | 4775 | 6616 | —— | 16 687 |
| Manganese | 114.550 | 114.550 | 135.896 | 132.872 | —— |
| Sulphur | —— | 61 026 | —— | 33 175 | 54 414 |
Food industry
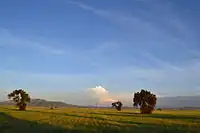
In terms of processing agricultural and livestock products, there are 3518 establishments dedicated to this area, the municipalities with the highest number are Pachuca, Ixmiquilpan, Actopan, and Tula, which together represent 29.8% of the total.[22]
The products that make up the food industry sector in the state are: coffee, malt, honey, jams, sauces, carbonated beverages and carbonated water, products for breadification and food additives, sausagess, fryings and milk and their derivatives such as: cheese, heavy cream, yogurt and ice cream among others.[23]
The Tizayuca Dairy Basin, created in 1976, has the Tizayuca Agroindustrial Complex (Caitsa) and occupies 120 h of land, in which 126 stables and 25,000 cows are located.[43] There are 90 producers working there, generating 2300 direct jobs and 7500 indirect jobs, and a combined production of 500,000 liters of milk.[44] In the 1990s, the ranchers created their own production and marketing company under the name of Leche Real de Tizayuca, but in 2009 it went bankrupt.[45] In 1976, the dairy basin produced 2.8 million liters per week,[45] in 2008 its production was around 1.4 million per week,[45] and in 2010 the production is around 500,000 liters per week.[46] In 2012, the 70 active stables sold their product to firms such as: Santa Clara, Alpura, and Liconsa.[45]
The Santa Clara Productos Lácteos company was founded in Pachuca in 1924 with just a small herd of 17 Creole cows and in 2012 it is classified among the top 5 Mexican dairy groups, manufacturer of milk, yogurt, cream, ice cream, cheese and coffee.[47] It processes more than 200,000 liters of milk per day, of which 75% is used for milk and the remaining 25 % is used for the production of ice cream, yogurt and cheese.[47] In Tizayuca there is a plant of the company Fritos Totis.
Manufacturing
Manufacturing industries are the most important sector in Hidalgo, contributing 28.84% of Hidalgo's GDP.[3] In the area of productive infrastructure, the state has thirteen industrial and/or technological parks operating, located in Pachuca de Soto, Mineral de la Reforma, Tula de Allende, Tizayuca, Huejutla de Reyes, Atitalaquia and Ciudad Sahagún.[9]
The textile and clothing sector is one of the most important sectors for Hidalgo. The municipalities with the highest levels of production of textile inputs and finishes, textile products and clothing are Tepeji del Río de Ocampo, Tizayuca, Tlaxcoapan, Zapotlán, Tlanalapa, Tepeapulco, Pachuca de Soto, Mineral de la Reforma, Progreso de Obregón, Actopan, Cuautepec de Hinojosa and Tulancingo de Bravo.[48]
In 1952, the industrial zone of Ciudad Sahagún was created, it was considered the most important industrial center in Mexico, the area had about 40,000 workers. In 1986 a cycle of 36 years of industrial heyday came to an end, in which the companies Constructora Nacional de Carros de Ferrocarril (CNCF), Diesel Nacional S.A. (Dina), Dikona (Dina-Komatsu) and National Steelworks (Sidena), closed.[49] In 2008, there were three major companies located in the industrial corridor of Ciudad Sahagún: the U.S. transnational ASF-Keystone, the Canadian Bombardier-Concarril and the Japanese Komatsu Mexicana, which reached 3,200 jobs between them.[50] There are 17 medium-sized companies, divided into metalworking, automotive and railway; there are Aceros Corsa, Aerospace, American Coach, CAPDTIMM, CAPROME, CIMMATH, Dina-Camiones, Ferro Partes Mexicanas, Giant Motors, Global Transporte, Grupo Bler, Gunderson-Concarril, Kapton, Maquinados Teysa, MET-MET, SYCSA, Té Laggs and Timsa.[50] In addition, there are 40 micro-enterprises, including the maquilado, embroidery, dairy products and profiling of metalworking parts, associated in the corporation called Industriales de Sahagún, AC (ISAC).[50] Industries in the area account for almost 11,800 established jobs.[50]
Petroleum industry
.jpg.webp)
As for the oil industry, there is the "Miguel Hidalgo" refinery in Tula de Allende, its facilities occupy a total area of 749 hectares;[51] It was the first refinery to be fully planned with high-capacity hydrocarbon processing plants.[51] Its construction was carried out in several stages, the first stage being inaugurated on March 18, 1976.[52]
This refinery is considered one of the most important in the country due to its installed capacity, and the share of the market it controls, since it processes 24% of the total crude oil that is refined in Mexico.[51] The average production volume of refined products was 127,821,900 barrels, of which 40.1% corresponded to gasoline; 28.5% to fuel oil; 19.3% to diesel; 6.3% to kerosene and the remainder to liquefied gas, industrial fuel and asphalts.[51] In addition, three important gas pipelines pass through the state (Poza Rica-Venta de Carpio, Zempoala-Salamanca and Tabasco-Salamanca).[34]
The petrochemical industry produced 263 974 tonnes in 1998; Of these, 15.9% corresponded to sulphur, 20.2% to acrylonitrile, 36.9 % to propylene, 24.3% to carbon black and the rest to hydrocyanic acid and acetonitrile.[23]
Construction
The construction industry participated in 1997 with 3.61% of Hidalgo's GDP; This percentage is slightly lower than the national average of 4.6%).[23] In 1998, the value of production in the construction industry amounted to 298.6 million pesos, of which 77.2% was public works and 22.8% private works.[23] Of this amount, 29.5% corresponded to buildings, 25.3% to transport, 16.1% to oil and petrochemicals, 12.7% to other constructions, 10% to electricity and communications and 6.4% to water, irrigation and sanitation.[23] There are 146 construction companies in the state: 127 are micro, 8 small, 4 medium and 7 large, employing 2054 employees and workers.[23]
The Cementera Cruz Azul is a Mexican company in the construction industry.[53] It has four plants, one of which is located in the Cruz Azul Cooperative City, the city was born with the installation of a cement factory at the end of the 19th century, installed in what was the former Hacienda de Jasso, in the southwest of the state within the municipality of Tula de Allende.[53]
The cement industry is made up of four large companies: Cementos Mexicanos, Cruz Azul, Portland Blanco de México and Apasco, whose growth has been significant in recent years, generating a significant economic spillover in the state.[23] The Cementera Santa Anita crusher and materials processing plant has about 372 hectares in the Mezquital Valley; This plant generated around 1,200 jobs during its construction; Already in operation, it represents no less than 900 direct and indirect jobs.
Energy
.jpg.webp)
In electricity, this sector accounted for 3.87% of the state's GDP in 1997 , higher than the national average (1.2%), and 4.3% of the national electricity GDP.[23] In the same year, Hidalgo accounted for 8.7% of the total electricity generated in the country.[23] Of the energy generated, 91.5% comes from thermoelectric plants. The value of sales was 996.2 million pesos.[23] In terms of the degree of electrification of the State, in 1998 a total of 1405 localities were served, with 469,028 electrical outlets.[23]
In terms of power generation, the state is self-sufficient as it has electricity generating plants in different municipalities, the state generates 9.4% of the country's electrical energy with 2900 megawatts (MW).[34] The Fernando Hiriart Balderrama Dam, located in the riverbed that joins the rivers Tula and Moctezuma at Zimapán was launched on September 27, 1996.[54] The curtain has a height of 203 meters from the floor to the crown and has a hydroelectric power plant capable of generating 292 megawatts of electricity.[55]
Tertiary activities
Trade
Commerce in the state has been stable in recent years; being the second sector with the highest contribution to the state's GDP.[56] Hidalgo has seven supply centers, 60 markets, and 211 tianguis.[56] 54% of the municipalities do not have a public market and the inhabitants of these municipalities are supplied through tianguis that are set up at least once a week.[56]
By branches commercial, the most important in terms of the personnel it employs, is that of retail food products, which includes groceries, butchers, poultry shops and others.[20] Secondly, we have pharmaciess, haberdashery, shoe stores, and clothing stores, among others.[20]
Thirdly, according to its importance, is the wholesale food trade, where we find establishments distributing fruits, eggs, groceries, beverages and others.[20] Trade is concentrated in the main urban centers such as Pachuca de Soto, Tulancingo de Bravo, Actopan, Huejutla de Reyes and Tula de Allende.[20] Hidalgo's foreign trade went from a deficit in 2000 to 2004 to a surplus from 2005 to 2009. The main export products during the period from January to December 2009 were vehicles and railway equipment, cotton, clothing and accessories, rubber and its derivatives, machinery, apparatus and mechanical devices.[20]
During 2014 in Hidalgo, the value of exports reached an amount of 1721.6 million pesos, which represented 0.5% at the national level. The manufacturing industry stood out as the main activity with an export value of 1,719.1 million pesos.[9] The subsectors with the highest participation were: petroleum and coal products (40.1%) and transport equipment (34.4%).[4] With respect to remittances, it reached a total of 725.2 million pesos during the period January–December 2015.[9]
Tourism
The state of Hidalgo can be consolidated as an important tourist destination in Mexico, representing 1.6% of the national tourism offer.[57] It also offers a wide market of tourist services, 567 hotels, 598 restaurants, 102 spas, 93 bars, 22 nightclubs, 74 travel agencies, 5 hunting ranches, 39 rental and transport companies and five golf courses.[57]
The State of Hidalgo is divided into six tourist corridors: the Spa Corridor, the Mountain Corridor, the Four Elements Corridor, the Toltec Corridor, the Hacienda Corridor and the Sierra-Huasteca Corridor, which represent differentiated levels of development and tourism products.[57]
Tourist destinations are visited annually by an average of 1,800,000 tourists.[58] In 2010 alone, 310,322 tourists arrived in Pachuca, of which 86% (276,351 ) were residents of the country. At the state level, 1,063,757 tourists arrived at lodging establishments, with a percentage of 94% of national origin.[59] The Hidalgo Fair receives an average of 750 to 850 thousand visitors per edition.[60]
Spa Corridor
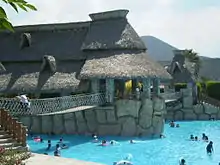
Within the Mezquital Valley is one of the most representative areas of the Otomi region. Located at more than 1500 m s. n. m., enjoys a benign climate, conducive to the most interesting tourist explorations.[61]
The Spa Corridor is characterized by spas of thermal waters, which spring at average temperatures of 38 °C, since the geographical location places it On the Transversal Neovolcanic Axis and therefore beneath the earth there are cracks and magma rivers that heat the aquifers and enrich them with minerals, sulfates, carbons and nitrates; This corridor passes through the municipalities of El Arenal, Cardonal, Actopan, Santiago de Anaya, Ixmiquilpan, Tasquillo, Tecozautla and Huichapan.[61]
Mountain Corridor

The name of the corridor is born due to the geographical area it occupies within the state of Hidalgo, due to the natural characteristics of each municipality that integrates it.[62] The Mountain Corridor is visited for its attractive ecotourism, where you can practice sports such as rappelling, mountaineering, canoeing, sport fishing and paragliding.[62]
Here we find interesting examples of historical monuments, both civil and religious, as well as their mining haciendas of the 17th century built by Pedro Romero de Terreros, the Count of Regla. It has the mining towns of Huasca de Ocampo, Real del Monte and Mineral del Chico, which are part of the program called Magical Towns.[63]
Corridor of the 4 Elements
According to the characteristics of this, the route name of the 4 elements is defined by knowing what each of them offered, the air, which allows you to live the experience of flying in a hot air balloon, the water present in the immense waterfalls and lagoons where you can practice sport fishing or, take a boat ride, the fire, through the manufacture of cast iron products in the Apulco factory and the land, through its expanses and beautiful landscapes, where exotic food such as deer, crocodile and ostrich stand out.[64][65] It is made up of the municipalities of Tulancingo, Acaxochitlán, Metepec, Tenango de Doria and San Bartolo Tutotepec.[61][65]
Toltec Corridor
The Toltec Corridor because of the geographical area it occupies within the state, the Toltec culture, is characterized by the municipalities of Mixquiahuala, Tlahuelilpan, Atotonilco de Tula, Tula de Allende and Tepeji del Río.[66][65]
This corridor is characterized by the diversity of attractions, history and tradition that exist in each of its municipalities, when making a tour you can visit from the archaeological zone of Tula, one of the human settlements of great importance in Mesoamerica, to magnificent former convents of the 16th century, or hot springs that gush at more than 38 °C.[64][65]

Corridor of the haciendas
The Corridor of the Haciendas, on this route there are the centers of haciendas that were built during the 16th century, 17th century, 18th century and 19th century, is made up of municipalities of Zempoala, Tepeapulco and Apan.[64][65] This corridor is made up of municipalities in which you can visit from typical villages that preserve their roots, to the area of the altiplanicie pulquera, where it is advisable to visit the haciendas dedicated to the production of pulque, as well as some of the religious complexes, an archaeological zone, and civil constructions such as the Aqueduct of Padre Tembleque.[64][65]
Corridor of the Sierra and the Huasteca
This is an adventurous route, so it is recommended to go with an explorer's mindset.[62][65] It is a route for contact with nature, landscapes and very suitable for photography; it runs through the area known as Sierra Baja and Alta, to end in the Huasteca. Due to its hot and humid climate, its impressive landscapes, its delicious dishes and its crafts, it is essential to dedicate a good time to this tour.[66][65]
Urban corridor of Pachuca and its surroundings
Pachuca is the most important city in the state. The municipality's tourism infrastructure is as follows: 32 lodging establishments with a capacity of 1,471 rooms, 157 beverage and food preparation establishments and 36 travel agencies, 13 car rental companies, 4 convention centers and 1 golf course.[59]
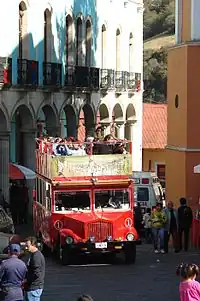
The main tourist attractions of the city are the buildingss, monuments, and museumss of the historic center, as well as the various cultural centers in the other parts of the city, highlighting the David Ben Gurion Park.[67] The Hidalgo Stadium is a major tourist attraction, especially during the matches of the Primera División of Mexican Soccer.[67] In the city there is a Turibus called Tranvía Turístico de Pachuca, installed in 2003 that runs through the main attractions of the city center.[67]
The Calinda Hotel which was established in 1987 and is now Fiesta Inn, later the Hotel Excelencia Plaza in 1992, Hotel La Joya in 1993, the Camino Real Hotel in charge of the Angeles Business Group (formerly Crowne Plaza Hotel) which was established in 2005; and the Holiday Inn Hotel are a sample of the hotelses in the city. One of the most requested products by tourists is pasta.[67]
See also
References
- ↑ Parray Joel Cortés, José Ángel (October 28, 2007). "The legal tricks of the Zona Plateada". El Universal (Mexico). Retrieved June 3, 2010.
- 1 2 "Human Development Index for the states, Mexico 2015" (PDF). United Nations Development Programme in Mexico. 2015. Archived from the original (PDF) on 5 March 2016. Retrieved 27 December 2015.
- 1 2 3 4 "Economic structure of Hidalgo in summary" (PDG). National Institute of Statistics and Geography. 2015. Retrieved March 9, 2017.
- 1 2 "State Economic Information, Hidalgo" (PDF). Ministry of Economy. Government of Mexico. 2015. Retrieved March 7, 2017.
- 1 2 "Hidalgo". Ministry of Economy. Government of Mexico. Retrieved March 14, 2017.
- ↑ "PIB - Federative Entity, annual". National Institute of Statistics and Geography. Retrieved March 9, 2017.
- 1 2
- 1 2 Ameth, Emmanuel (January 23, 2010). "Tula and Pachuca have 60% of the state's GDP". Milenio Diario. Grupo Editorial Milenio. Archived from the original on June 29, 2012. Retrieved July 5, 2012.
- 1 2 3 4
- 1 2 3 4 "Human Development Index, 2010 Hidalgo" (PDF). Consejo Estatal de Poblacion. Gobierno del Estado de Hidalgo. Archived from the original (PDF) on 3 March 2017. Retrieved 3 March 2017.
- ↑ "Municipal Human Development Index in Mexico: New methodology" (PDF). United Nations Development Programme in Mexico. 2014. Archived from the original (PDF) on May 17, 2017. Retrieved March 3, 2017.
- 1 2 3 4 Undersecretary of Employment and Labor Productivity (2017). "Hidalgo. Labor Information" (PDF). Ministry of Labor and Social Welfare. Government of Mexico. Retrieved 15 March 2017.
- 1 2
- ↑ "Economic Censuses 2014 : Hidalgo" (PDF). National Institute of Statistics and Geography. Retrieved March 15, 2017.
- 1 2 3 "State Poverty 2014. Hidalgo". National Council for the Evaluation of Social Development Policy. Retrieved 3 March 2017. 9.2
- 1 2 "Poverty 2014 Hidalgo" (PDF). National Council for the Evaluation of Social Development Policy. 2014. Retrieved March 3, 2017.
- 1 2 3 4 5 6 "Report on poverty and evaluation in the state of Hidalgo 2012-2013" (PDF). National Council for the Evaluation of Social Development Policy. 2013. Retrieved December 14, 2015.
- ↑ "HIDALGO Index and Degree of Marginalization 2010 -2015" (PDF). Consejo Estatal de Poblacion. Government of the State of Hidalgo. 2015. Archived from the original (PDF) on March 4, 2017. Retrieved March 3, 2017.
- ↑
- 1 2 3 4 5 6 7 8 9 10 11 12 13 14 "State Development Plan 2011-2016" (PDF). Government of the State of Hidalgo. Archived from the original (PDF) on May 12, 2012. Retrieved July 25, 2012.
- 1 2 3 4 "Update of the Sectoral Program for Agricultural Development (2011-2016)" (PDF). Secretaría de Desarrollo Agropecuario. Government of the State of Hidalgo. Archived from the original (PDF) on 12 March 2017. Retrieved March 9, 2017.
- 1 2 3 4 5 6
- 1 2 3 4 5 6 7 8 9 10 11 12 13 "Economic Activity of the State of Hidalgo". Encyclopedia of the Municipalities and Delegations of Mexico. National Institute for Federalism and Municipal Development. Archived from the original on May 28, 2007. Retrieved July 11, 2010.
- ↑ "Livestock in Hidalgo". Secretariat of Agricultural Development. Government of the state of Hidalgo. Archived from the original on February 8, 2016. Retrieved December 27, 2015.
- 1 2 "Aquaculture and Fishing". Secretaría de Desarrollo Agropecuario. Government of the State of Hidalgo. Archived from the original on January 19, 2016. Retrieved December 27, 2015.
- ↑ Ambriz, César Amador; Hernández Veleros, Zeus Salvador. "The Exploitation of Forest Resources in the State of Hidalgo, 1980 - 1999". Investigación Económica. es:Universidad Autónoma del Estado de Hidalgo. Retrieved 5 July 2012.
- ↑ "State Forestry Program of Hidalgo (2011-2016)" (PDF). Secretaría de Medio Ambiente y Recursos Naturales. Government of the State of Hidalgo. Archived from the original (PDF) on March 12, 2017. Retrieved March 8, 2017.
- ↑ "Update of the Environment and Natural Resources Sector Program (2011-2016)" (PDF). Secretaría de Medio Ambiente y Recursos Naturales. Government of the State of Hidalgo. Archived from the original (PDF) on 12 March 2017. Retrieved March 8, 2017.
- 1 2 3
- ↑ "Hidalgotrade a window into Hidalgo, Mexico". Hidalgo Trade. Archived from the original on April 1, 2009. Retrieved June 3, 2010.
- 1 2 3 Maximiliano, Gracia Hernández (November 12, 2014). "The state of Hidalgo, miner by tradition". Milenio Diario. Grupo Editorial Milenio. Retrieved December 28, 2015.
- ↑ José Luis, Rico (November 2, 2015). "Current mining tradition in Hidalgo". es:El Sol de Hidalgo. Organización Editorial Mexicana. Archived from the original on January 6, 2016. Retrieved December 28, 2015.
- 1 2
- 1 2 3 "Panorama Minero del Estado de Hidalgo" (PDF). Ministry of Economy. Government of Mexico. 2014. Retrieved March 7, 2017.
- 1 2 3
- ↑ Elvira Eva, Saavedra Silva; María Teresa, Sánchez Salazar (2008). "Investigaciones Geográficas, Boletín del Instituto de Geografía". Mining and space in the Pachuca-Real del Monte mining district in the nineteenth century (PDF). Mexico City: National Autonomous University of Mexico. pp. 82–101. ISSN 0188-4611. Archived from the original (PDF) on June 16, 2015. Retrieved January 9, 2015.
- 1 2 3 4 5 Andrés, Azpeitia Caballero (2007). "Minerals of the metallic mining districts Zimapán, Pachuca-Real del Monte, Molango and its didactic application". es:Universidad Autónoma del Estado de Hidalgo. Retrieved January 7, 2016.
- ↑ "Anuario Estadístico de Hidalgo, edición 2003. Mining". National Institute of Statistics and Geography. 2003. Retrieved June 17, 2010.
- ↑ "Anuario Estadístico de Hidalgo, edición 2004. Mining". National Institute of Statistics and Geography. 2004. Retrieved June 17, 2010.
- ↑ "Anuario Estadístico de Hidalgo, edición 2005. Mining". National Institute of Statistics and Geography. 2005. Retrieved June 17, 2010.
- ↑ "Anuario Estadístico de Hidalgo, edición 2006. Mining". National Institute of Statistics and Geography. 2006. Retrieved June 17, 2010.
- ↑ "Anuario Estadístico de Hidalgo, edición 2007. Mining". National Institute of Statistics and Geography. 2007. Retrieved 17 June 2010.
- ↑
- ↑ Araceli López Islas (3 May 2008). "Bankruptcy in dairy production of Tizayuca". Hidalgo. Contralínea. Archived from the original on 5 October 2013. Retrieved July 5, 2012.
- 1 2 3 4 Carlos Camacho (May 9, 2010). "In danger of extinction, the Tizayuca dairy basin". La Jornada. Retrieved July 5, 2012.
- ↑ Agencia Reforma (May 8, 2012). "Almost bankrupt, the dairy basin". Criterio Hidalgo newspaper. Archived from the original on October 4, 2013. Retrieved July 5, 2012.
- 1 2 Darío Celis (July 4, 2012). "Via Jugos del Valle, FEMSA takes control of dairy producer Santa Clara". Excelsior Mexico. Retrieved July 5, 2012.
- ↑ "Update of the Economic Development Sector Program 2011-2016 (2011-2016)" (PDF). Secretaría de Desarrollo Agropecuario. Government of the State of Hidalgo. Archived from the original (PDF) on 12 March 2017. Retrieved March 9, 2017.
- ↑ Luis Frías (director) (2008). Ciudad Nostalgia (Internet). Ciudad Sahagún, Mexico: Cine-Fábrica Producciones, Programa de Apoyo a las Culturas Municipales Y Comunitaria. Event occurs at 40 minutes. Retrieved December 9, 2011.
- 1 2 3 4 Quijano, Mirna (7 May 2008). "There are 60 companies established in Ciudad Sahagún, Tepeapulco". Milenio Diario. Grupo Editorial Milenio. Archived from the original on 29 June 2012. Retrieved 5 July 2012.
- 1 2 3 4 Martínez, Luis. "The Miguel Hidalgo Refinery". Petróleos Mexicanos. Archived from the original on July 1, 2012. Retrieved June 18, 2012.
- ↑ "History of PEMEX". Petróleos Mexicanos. Archived from the original on November 29, 2011. Retrieved December 9, 2011.
- 1 2 "La Cruz Azul, S.C.L." Sitio Web Oficial. Archived from the original on July 23, 2012. Retrieved July 5, 2012.
- ↑ Heidy, Wagner (May 19, 2010). "Zimapán magna hydroelectric dam of the Semidesert". Centro Virtual de Información del Agua. Archived from the original on March 10, 2016. Retrieved December 27, 2015.
- ↑ "List of Hydroelectric Generating Plants". Federal Electricity Commission. April 5, 2011. Archived from the original on April 26, 2011. Retrieved April 18, 2011.
- 1 2 3
- 1 2 3 "Update of the Tourism and Culture Sector Program (2011-2016)" (PDF). Secretaría de Desarrollo Agropecuario. Government of the State of Hidalgo. Archived from the original (PDF) on April 26, 2016. Retrieved March 9, 2017.
- ↑ "Tourism in Hidalgo". es:Gobierno del Estado de Hidalgo. Archived from the original on 28 July 2012. Retrieved 26 July 2012.
- 1 2 "Municipal Development Plan of Pachuca de Soto (2012-2016" (PDF). City of Pachuca de Soto. 2012. Archived from the original (PDF) on May 25, 2013. Retrieved April 27, 2012.
- ↑ "La de Pachuca one of the best fairs". El Sol de Hidalgo. November 22, 2011. Archived from the original on July 3, 2012. Retrieved December 15, 2011.
- 1 2 3 "Hidalgo tourist routes". Secretaria of Tourism of the State of Hidalgo. Archived from the original on July 28, 2010. Retrieved July 22, 2010.
- 1 2 3
- ↑ "Programa Pueblos Mágicos". es:Secretaría de Turismo (México). Archived from the original on August 24, 2014. Retrieved July 19, 2010.
- 1 2 3 4
- 1 2 3 4 5 6 7 8 Secretary of Tourism of Hidalgo. "Corredores Turísticos de Hidalgo". Government of the State of Hidalgo. Archived from the original on August 14, 2012. Retrieved July 26, 2012.
- 1 2
- 1 2 3 4 "Welcome to Hidalgo". Secretaria de Turismo del Estado de Hidalgo. Archived from the original on August 14, 2012. Retrieved July 22, 2010.
