Kinkō
錦江町 | |
|---|---|
Town | |
 Flag  Emblem | |
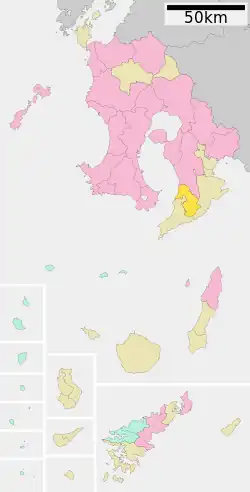
 Location of Kinkō in Kagoshima Prefecture | |
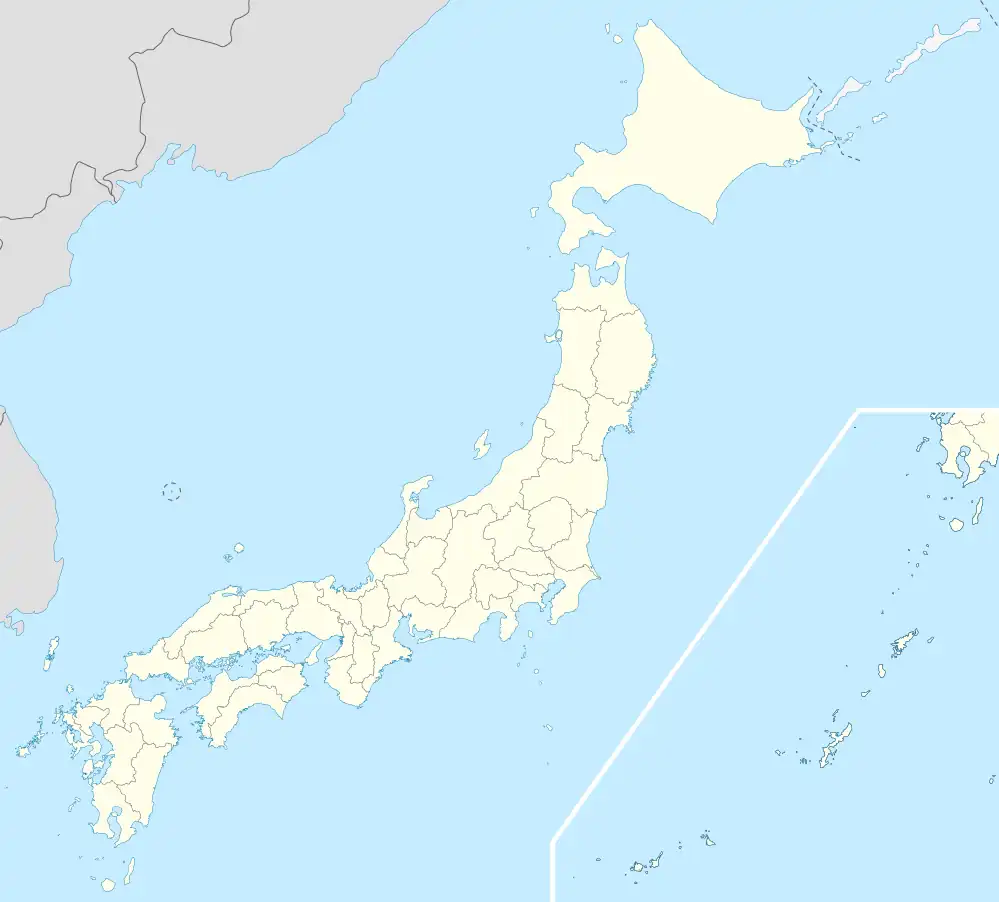
 Kinkō Location in Japan | |
| Coordinates: 31°13′28″N 130°52′35″E / 31.22444°N 130.87639°E | |
| Country | Japan |
| Region | Kyushu |
| Prefecture | Kagoshima Prefecture |
| District | Kimotsuki |
| Area | |
| • Total | 163.15 km2 (62.99 sq mi) |
| Population (July 2010) | |
| • Total | 9,328 |
| • Density | 57/km2 (150/sq mi) |
| Time zone | UTC+09:00 (JST) |
| Climate | Cfa |
| Website | www |
Kinkō (錦江町, Kinkō-chō) is a town located in Kimotsuki District, Kagoshima Prefecture, Japan.
The town was formed on March 22, 2005 from the merger of the towns of Ōnejime and Tashiro, both from Kimotsuki District.
As of July 2010, the town has an estimated population of 9,328. The total area is 163.15 km².
Geography
Climate
Kinkō has a humid subtropical climate (Köppen climate classification Cfa) with hot summers and mild winters. Precipitation is significant throughout the year, and is heavier in summer, especially the months of June and July. The average annual temperature in Kinkō is 16.4 °C (61.5 °F). The average annual rainfall is 2,880.2 mm (113.39 in) with June as the wettest month. The temperatures are highest on average in August, at around 26.1 °C (79.0 °F), and lowest in January, at around 6.6 °C (43.9 °F).[1] Its record high is 35.7 °C (96.3 °F), reached on 18 August 2020, and its record low is −10.4 °C (13.3 °F), reached on 25 January 2016.[2]
| Climate data for Kinkō (1991−2020 normals, extremes 1977−present) | |||||||||||||
|---|---|---|---|---|---|---|---|---|---|---|---|---|---|
| Month | Jan | Feb | Mar | Apr | May | Jun | Jul | Aug | Sep | Oct | Nov | Dec | Year |
| Record high °C (°F) | 22.2 (72.0) |
23.7 (74.7) |
25.8 (78.4) |
27.6 (81.7) |
31.5 (88.7) |
32.9 (91.2) |
35.1 (95.2) |
35.7 (96.3) |
34.1 (93.4) |
31.2 (88.2) |
27.4 (81.3) |
24.1 (75.4) |
35.7 (96.3) |
| Mean daily maximum °C (°F) | 11.6 (52.9) |
13.0 (55.4) |
16.0 (60.8) |
20.3 (68.5) |
24.1 (75.4) |
26.3 (79.3) |
30.1 (86.2) |
30.8 (87.4) |
28.6 (83.5) |
24.2 (75.6) |
19.0 (66.2) |
13.8 (56.8) |
21.5 (70.7) |
| Daily mean °C (°F) | 6.6 (43.9) |
7.8 (46.0) |
10.7 (51.3) |
14.9 (58.8) |
18.8 (65.8) |
22.2 (72.0) |
25.8 (78.4) |
26.1 (79.0) |
23.5 (74.3) |
18.6 (65.5) |
13.3 (55.9) |
8.3 (46.9) |
16.4 (61.5) |
| Mean daily minimum °C (°F) | 1.4 (34.5) |
2.2 (36.0) |
5.2 (41.4) |
9.2 (48.6) |
13.7 (56.7) |
18.6 (65.5) |
22.2 (72.0) |
22.4 (72.3) |
19.5 (67.1) |
13.7 (56.7) |
7.9 (46.2) |
2.9 (37.2) |
11.6 (52.9) |
| Record low °C (°F) | −10.4 (13.3) |
−6.8 (19.8) |
−4.5 (23.9) |
−1.4 (29.5) |
4.0 (39.2) |
8.2 (46.8) |
12.9 (55.2) |
14.7 (58.5) |
8.5 (47.3) |
0.3 (32.5) |
−3.1 (26.4) |
−6.1 (21.0) |
−10.4 (13.3) |
| Average precipitation mm (inches) | 90.1 (3.55) |
130.8 (5.15) |
170.5 (6.71) |
205.1 (8.07) |
235.0 (9.25) |
613.6 (24.16) |
413.9 (16.30) |
317.2 (12.49) |
334.9 (13.19) |
157.0 (6.18) |
121.9 (4.80) |
98.2 (3.87) |
2,880.2 (113.39) |
| Average precipitation days (≥ 1.0 mm) | 9.6 | 10.2 | 13.1 | 11.0 | 11.1 | 17.3 | 12.7 | 14.5 | 12.7 | 8.7 | 9.2 | 9.3 | 139.4 |
| Mean monthly sunshine hours | 116.6 | 125.0 | 154.6 | 168.9 | 166.3 | 95.6 | 179.1 | 187.9 | 152.2 | 168.2 | 145.6 | 126.5 | 1,785.2 |
| Source: Japan Meteorological Agency[2][1] | |||||||||||||
Demographics
Per Japanese census data, the population of Kinkō in 2020 is 6,944 people.[3] Kinkō began the census in 1920, and the town's population peaked in the 1950s at more than 22,000 people; the population has continued to decline since then. After the 2010s, Kinkō's population has fallen below 10,000.
| Year | Pop. | ±% |
|---|---|---|
| 1920 | 15,245 | — |
| 1925 | 15,126 | −0.8% |
| 1930 | 16,080 | +6.3% |
| 1935 | 16,942 | +5.4% |
| 1940 | 17,351 | +2.4% |
| 1945 | 20,760 | +19.6% |
| 1950 | 21,980 | +5.9% |
| 1955 | 22,552 | +2.6% |
| 1960 | 21,967 | −2.6% |
| 1965 | 19,726 | −10.2% |
| 1970 | 16,736 | −15.2% |
| 1975 | 14,959 | −10.6% |
| 1980 | 13,829 | −7.6% |
| 1985 | 13,043 | −5.7% |
| 1990 | 12,239 | −6.2% |
| 1995 | 11,608 | −5.2% |
| 2000 | 10,889 | −6.2% |
| 2005 | 10,015 | −8.0% |
| 2010 | 8,979 | −10.3% |
| 2015 | 7,923 | −11.8% |
| 2020 | 6,944 | −12.4% |
| Kinkō population statistics[3] | ||
References
- 1 2 気象庁 / 平年値(年・月ごとの値). JMA. Retrieved March 27, 2022.
- 1 2 観測史上1~10位の値(年間を通じての値). JMA. Retrieved March 27, 2022.
- 1 2 Kinkō population statistics
External links
 Media related to Kinkō, Kagoshima at Wikimedia Commons
- Kinkō official website (in Japanese)