Shibushi
志布志市 | |
|---|---|
 View of Downtown Shibushi and Shibushi Port, from Shibushi International Forest Park | |
 Flag  Chapter | |
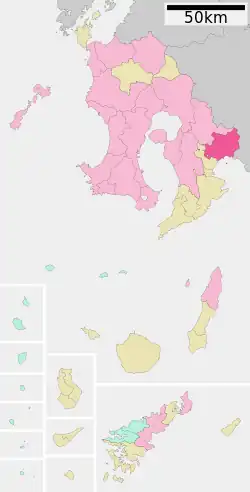
 Location of Shibushi in Kagoshima Prefecture | |
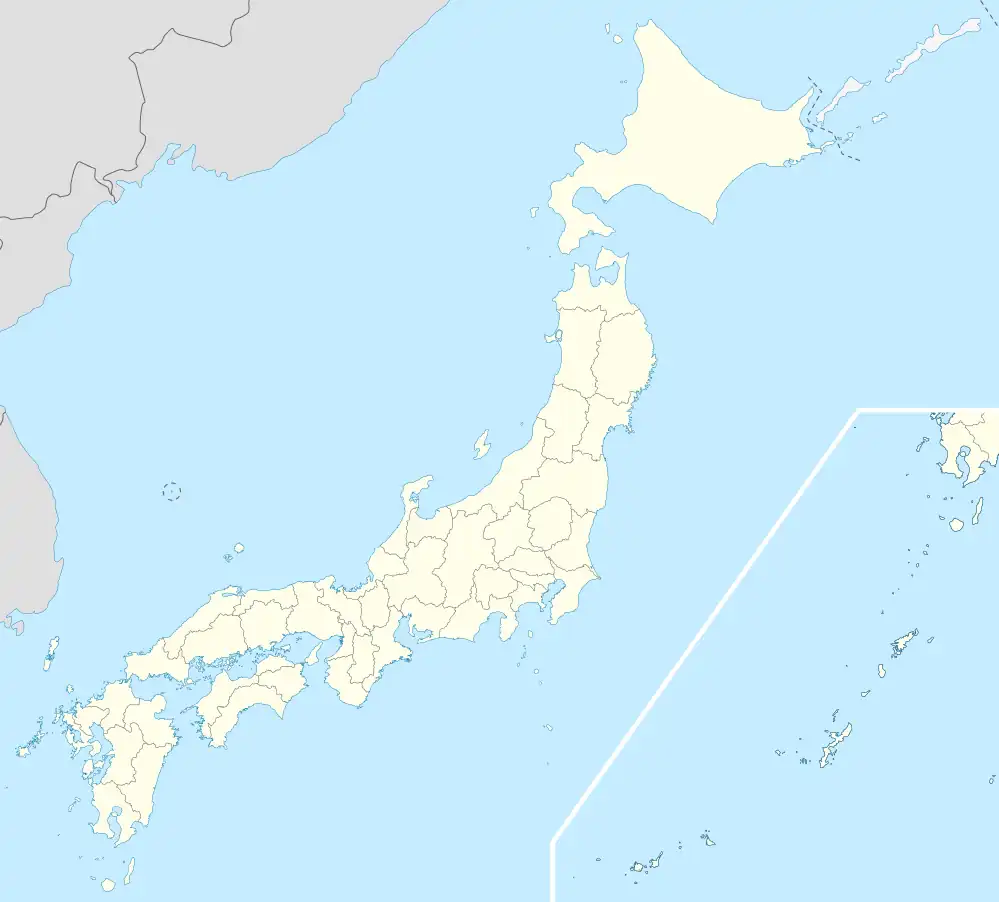
 Shibushi Location in Japan | |
| Coordinates: 31°30′N 131°3′E / 31.500°N 131.050°E | |
| Country | Japan |
| Region | Kyushu |
| Prefecture | Kagoshima Prefecture |
| Government | |
| • Mayor | Sumiyuki Shimohira (since February 2018) |
| Area | |
| • Total | 290.28 km2 (112.08 sq mi) |
| Population (October 31, 2021) | |
| • Total | 30,231 |
| • Density | 100/km2 (270/sq mi) |
| Time zone | UTC+09:00 (JST) |
| City hall address | Shibushi, Shibushi-cho,
Shibushi-shi No. 1 |
| Climate | Cfa |
| Website | www |
| Symbols | |
| Flower | Sunflower |
| Tree | Livistona |
Shibushi (志布志市, Shibushi-shi) is a city located in Kagoshima Prefecture, Japan. As of October 31, 2021, the city has an estimated population of 30,231, with 15,366 households and a population density of 104 persons per km2. The total area is 290.28 km2.
The modern city of Shibushi was established on January 1, 2006, from the merger of the former town of Shibushi, absorbing the towns of Ariake and Matsuyama (all from Soo District).
The city is served by the Nichinan Line of the JR Kyūshū railway system, which links it to the city of Miyazaki, the capital of the neighbouring prefecture of the same name.

Geography
Climate
Shibushi has a humid subtropical climate (Köppen climate classification Cfa) with hot summers and mild winters. Precipitation is significant throughout the year, and is heavier in summer, especially the months of June and July. The average annual temperature in Shibushi is 17.1 °C (62.8 °F). The average annual rainfall is 2,457.9 mm (96.77 in) with June as the wettest month. The temperatures are highest on average in August, at around 26.7 °C (80.1 °F), and lowest in January, at around 7.2 °C (45.0 °F).[1] Its record high is 36.7 °C (98.1 °F), reached on 16 August 2020, and its record low is −6.9 °C (19.6 °F), reached on 27 February 1981.[2]
| Climate data for Shibushi (1991−2020 normals, extremes 1977−present) | |||||||||||||
|---|---|---|---|---|---|---|---|---|---|---|---|---|---|
| Month | Jan | Feb | Mar | Apr | May | Jun | Jul | Aug | Sep | Oct | Nov | Dec | Year |
| Record high °C (°F) | 23.9 (75.0) |
25.1 (77.2) |
27.4 (81.3) |
29.7 (85.5) |
31.7 (89.1) |
33.4 (92.1) |
36.4 (97.5) |
36.7 (98.1) |
35.7 (96.3) |
32.5 (90.5) |
29.4 (84.9) |
23.7 (74.7) |
36.7 (98.1) |
| Mean daily maximum °C (°F) | 13.5 (56.3) |
14.8 (58.6) |
17.6 (63.7) |
21.7 (71.1) |
25.0 (77.0) |
26.6 (79.9) |
30.8 (87.4) |
31.6 (88.9) |
29.4 (84.9) |
25.3 (77.5) |
20.4 (68.7) |
15.4 (59.7) |
22.7 (72.8) |
| Daily mean °C (°F) | 7.2 (45.0) |
8.5 (47.3) |
11.6 (52.9) |
15.8 (60.4) |
19.5 (67.1) |
22.5 (72.5) |
26.3 (79.3) |
26.7 (80.1) |
24.2 (75.6) |
19.4 (66.9) |
14.2 (57.6) |
9.1 (48.4) |
17.1 (62.8) |
| Mean daily minimum °C (°F) | 2.2 (36.0) |
3.3 (37.9) |
6.3 (43.3) |
10.5 (50.9) |
14.9 (58.8) |
19.3 (66.7) |
23.0 (73.4) |
23.4 (74.1) |
20.6 (69.1) |
15.0 (59.0) |
9.4 (48.9) |
4.0 (39.2) |
12.7 (54.8) |
| Record low °C (°F) | −6.8 (19.8) |
−6.9 (19.6) |
−4.0 (24.8) |
−0.2 (31.6) |
5.5 (41.9) |
11.3 (52.3) |
15.4 (59.7) |
17.0 (62.6) |
10.3 (50.5) |
3.2 (37.8) |
−1.7 (28.9) |
−4.9 (23.2) |
−6.9 (19.6) |
| Average precipitation mm (inches) | 72.5 (2.85) |
112.3 (4.42) |
171.0 (6.73) |
191.9 (7.56) |
218.0 (8.58) |
556.4 (21.91) |
365.5 (14.39) |
225.3 (8.87) |
254.5 (10.02) |
134.7 (5.30) |
111.5 (4.39) |
78.9 (3.11) |
2,457.9 (96.77) |
| Average precipitation days (≥ 1.0 mm) | 7.3 | 8.5 | 12.0 | 10.5 | 10.4 | 16.7 | 11.7 | 11.7 | 11.1 | 7.9 | 8.0 | 6.6 | 122.4 |
| Mean monthly sunshine hours | 170.7 | 158.2 | 178.2 | 186.0 | 183.1 | 109.5 | 198.6 | 224.5 | 174.7 | 181.6 | 165.1 | 168.7 | 2,102.1 |
| Source: Japan Meteorological Agency[2][1] | |||||||||||||
Demographics
Per Japanese census data, the population of Shibushi in 2020 is 29,329 people.[3] Shibushi's population has been in slow decline since the census began in 1950, although it rebounded in the 1955 and 1975 censuses. As of 2020, the town's population is only 60% of what it was in the 1950s.
| Year | Pop. | ±% |
|---|---|---|
| 1950 | 50,726 | — |
| 1955 | 53,199 | +4.9% |
| 1960 | 51,766 | −2.7% |
| 1965 | 46,801 | −9.6% |
| 1970 | 40,812 | −12.8% |
| 1975 | 37,930 | −7.1% |
| 1980 | 38,404 | +1.2% |
| 1985 | 38,387 | −0.0% |
| 1990 | 37,316 | −2.8% |
| 1995 | 36,694 | −1.7% |
| 2000 | 35,966 | −2.0% |
| 2005 | 34,770 | −3.3% |
| 2010 | 33,041 | −5.0% |
| 2015 | 31,479 | −4.7% |
| 2020 | 29,329 | −6.8% |
| Shibushi population statistics[3] | ||
Notable people
- Chiyomaru Kazuki, sumo wrestler
- Chiyoōtori Yūki, sumo wrestler
Notable place
References
- 1 2 気象庁 / 平年値(年・月ごとの値). JMA. Retrieved March 27, 2022.
- 1 2 観測史上1~10位の値(年間を通じての値). JMA. Retrieved March 27, 2022.
- 1 2 Shibushi population statistics
- ↑ "続日本100名城" (in Japanese). 日本城郭協会. Retrieved 12 October 2021.
External links
- Shibushi City official website (in Japanese)