| |||||||||||||||||||||||||||||||||||||||||||||||||||||||||||||||||
24 seats to the European Parliament | |||||||||||||||||||||||||||||||||||||||||||||||||||||||||||||||||
|---|---|---|---|---|---|---|---|---|---|---|---|---|---|---|---|---|---|---|---|---|---|---|---|---|---|---|---|---|---|---|---|---|---|---|---|---|---|---|---|---|---|---|---|---|---|---|---|---|---|---|---|---|---|---|---|---|---|---|---|---|---|---|---|---|---|
| Turnout | 38.6% | ||||||||||||||||||||||||||||||||||||||||||||||||||||||||||||||||
| |||||||||||||||||||||||||||||||||||||||||||||||||||||||||||||||||
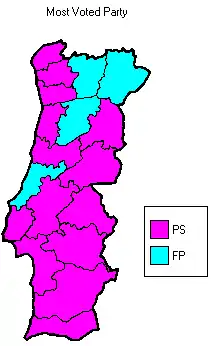
The 2004 European Parliament election in Portugal was the election of MEPs representing Portugal for the 2004-2009 term of the European Parliament. It was part of the wider 2004 European election. In Portugal the election was held on 13 June.
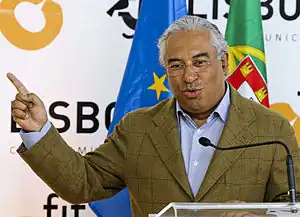
The Socialist Party (PS) was the big winner of the elections, achieving their best result in a European election ever. The party won 44.5% of the votes, an increase of 1.5%, and held on to the 12 seats won in 1999. However the Socialist victory, and the campaign overall, was overshadowed by the sudden death of the PS top candidate, António Sousa Franco. Sousa Franco died of a heart attack while campaigning in Matosinhos, just four days before election day. António Costa, number 2 on the list, became the Socialists' top candidate after Sousa Franco's death.
The Social Democrats (PSD) and the People's Party (CDS–PP) contested the election in a coalition called "Forward Portugal" (FP). The coalition had a very weak performance, winning just 33% of the votes, a big drop compared with the combined total of 39% the PSD+CDS had in 1999. The PSD lost two seats, while CDS–PP held on to their two seats.
The Democratic Unity Coalition (CDU) dropped 1% and fell below 10% of the votes for the first time. CDU was still able to hold on to the two seats they had won in 1999. The Left Bloc (BE) gained a seat for the EU parliament for the first time, and saw its share of vote increase to almost 5%, an increase of more than 3% compared with 1999.
Turnout dropped compared with 1999, with 38.6% of voters casting a ballot.
Electoral system
The voting method used for the election of European members of parliament, is proportional representation using the d'Hondt method, which is known to benefit the largest parties slightly. In the 2004 EU elections, Portugal had 24 seats to be filled. Deputies are elected in a single constituency, corresponding to the entire national territory.
Parties and candidates
The major parties that partook in the election, and their EP list leaders, were:[1]
- Left Bloc (BE), Miguel Portas
- Democratic Unity Coalition (CDU), Ilda Figueiredo
- Socialist Party (PS), António Costa[2]
- Social Democratic Party (PSD)/People's Party (CDS–PP) Força Portugal, João de Deus Pinheiro
Opinion polling
| Date Released | Polling Firm | Others | Lead | |||||||
|---|---|---|---|---|---|---|---|---|---|---|
| 13 June 2004 | Election Results | 44.5 12 seats |
33.3 9 seats |
9.1 2 seats |
4.9 1 seats |
8.2 0 seats |
11.2 | |||
| 13 June 2004 | Exit Poll – RTP1 Universidade Católica |
43.0–47.0 12 / 13 |
32.0–36.0 8 / 9 |
8.0–10.0 2 / 3 |
4.0–6.0 1 |
— |
11.0 | |||
| 13 June 2004 | Exit Poll – SIC Eurosondagem |
44.1–47.9 12 / 13 |
29.7–33.5 8 / 9 |
10.1–11.9 2 / 3 |
5.1–6.9 1 |
— |
14.4 | |||
| 13 June 2004 | Exit Poll – TVI Intercampus |
42.3–47.1 12 / 13 |
30.5–35.1 8 / 9 |
7.3–10.1 2 |
4.7–6.9 1 |
— |
11.8 12.0 | |||
| Exit polls | ||||||||||
| 11 June 2004 | Aximage | 40.3 | 39.8 | 8.3 | 6.2 | 5.5 | 0.5 | |||
| 11 June 2004 | Universidade Católica | 44.0 | 37.0 | 8.0 | 5.0 | 6.0 | 7.0 | |||
| 11 June 2004 | Eurosondagem | 43.3 | 37.8 | 7.7 | 5.6 | 5.6 | 5.5 | |||
| 11 June 2004 | Intercampus | 42.4 | 27.5 | 12.6 | 6.7 | 10.9 | 14.9 | |||
| 9 June 2004 | Marktest | 49.2 | 37.4 | 6.3 | 5.0 | 2.1 | 11.8 | |||
| 5 June 2004 | Aximage Seat projection |
39.2 11 / 12 |
34.5 9 / 10 |
7.9 2 |
2.4 1 |
16.0 – |
4.7 | |||
| 25 May 2004 | Aximage | 39.5 | 33.6 | 8.3 | 4.0 | 14.6 | 5.9 | |||
| 20 May 2004 | TNS Euroteste | 34.0 | 34.0 | 4.0 | 3.0 | 25.0 | Tie | |||
| 19 May 2004 | Marktest[lower-alpha 1] | 49.2 | 34.8 | 8.1 | 4.1 | 3.8 | 14.4 | |||
| 14 May 2004 | Universidade Católica | 44.3 | 40.7 | 5.4 | 5.2 | 4.4 | 3.6 | |||
| 7 May 2004 | Aximage Seat projection |
40.5 11 |
35.8 9 |
6.1 1 |
3.3 – |
14.3 3 |
4.7 | |||
| 29 March 2004 | Marktest | 54.7 | 34.5 | 5.5 | 2.4 | 3.0 | 20.2 | |||
| 19 March 2004 | Eurosondagem Seat projection |
37.0 11 |
37.6 11 |
5.8 1 |
4.3 1 |
15.3 – |
0.6 | |||
| 7 March 2004 | Aximage Seat projection |
39.2 10 |
39.7 11 |
7.0 2 |
3.7 1 |
10.4 – |
0.5 | |||
| 13 June 1999 | Election Results | 43.1 12 seats |
39.31 11 seats |
10.3 2 seats |
1.8 0 seats |
5.6 0 seats |
3.8 | |||
| 1 Sum of votes and seats of the Social Democratic Party (PSD) and of the People's Party (CDS–PP). | ||||||||||
National summary of votes and seats
| National party | European party |
Main candidate | Votes | % | +/– | Seats | +/– | |||
|---|---|---|---|---|---|---|---|---|---|---|
| Socialist Party (PS) | PES | António Costa | 1,516,001 | 44.52 | 1.45 |
12 | 0 | |||
| Forward Portugal (FP) • Social Democratic Party (PSD) • People's Party (CDS–PP) |
EPP | João de Deus Pinheiro | 1,132,769 | 33.27 | [3] | 9 7 2 |
2 0 | |||
| Democratic Unitarian Coalition (CDU) • Communist Party (PCP) • Ecologist Party (PEV) |
GUE/NGL | Ilda Figueiredo | 309,401 | 9.09 | 1.23 |
2 2 0 |
0 0 | |||
| Left Bloc (BE) | EACL | Miguel Portas | 167,313 | 4.91 | 3.12 |
1 | 1 | |||
| Workers' Communist Party (PCTP/MRPP) | None | António Garcia Pereira | 36,294 | 1.07 | 0.19 |
0 | 0 | |||
| New Democracy Party (PND) | None | Manuel Monteiro | 33,833 | 0.99 | new | 0 | new | |||
| People's Monarchist Party (PPM) | ECPM | Gonçalo da Câmara Pereira | 15,454 | 0.45 | 0.02 |
0 | 0 | |||
| Movement for the Sick (MD) | None | Vitorino Brandão | 13,840 | 0.41 | new | 0 | new | |||
| Earth Party (MPT) | ALDE | Luís Filipe Marques | 13,671 | 0.40 | 0.00 |
0 | 0 | |||
| Humanist Party (PH) | None | - | 13,272 | 0.39 | new | 0 | new | |||
| National Renovator Party (P.N.R.) | None | Paulo Rodrigues | 8,405 | 0.25 | new | 0 | new | |||
| Democratic Party of the Atlantic (PDA) | None | José Soares | 5,588 | 0.16 | 0.01 |
0 | 0 | |||
| Workers Party of Socialist Unity (POUS) | None | Carmelinda Pereira | 4,275 | 0.13 | 0.03 |
0 | 0 | |||
| Valid votes | 3,270,116 | 96.04 | ||||||||
| Blank and invalid votes | 134,666 | 3.96 | ||||||||
| Totals | 3,404,782 | 100.00 | — | 24 | 1 | |||||
| Electorate (eligible voters) and voter turnout | 8,821,456 | 38.60 | 1.33 |
|||||||
| Source: Comissão Nacional de Eleições Archived 2005-04-08 at the Wayback Machine | ||||||||||
Distribution by European group
| Groups | Parties | Seats | Total | % | |
|---|---|---|---|---|---|
| Party of European Socialists (PES) |
|
12 | 12 | 50.00 | |
| European People's Party–European Democrats (EPP–ED) |
|
7 2 |
9 | 37.50 | |
| European United Left–Nordic Green Left (GUE/NGL) |
|
2 1 |
3 | 12.50 | |
| Total | 24 | 24 | 100.00 | ||
Maps

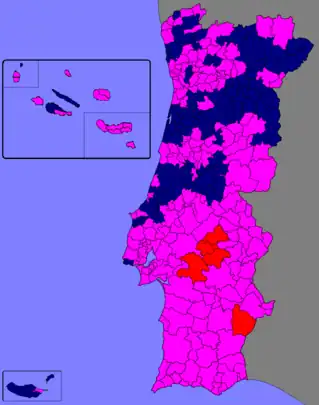
 Strongest party by municipality. Pink: PS; Darkblue: PSD-CDS; Red: CDU
Notes
- ↑ Results presented here exclude undecideds (34.7%) and abstainers (14.0%). With their inclusion results are: PS: 26.2%; PSD/CDS-PP: 18.5%; CDU: 4.3%; BE: 2,2%; Blank: 2.0%.
References
- ↑ Comissão Nacional de Eleições - Deputados, Mapa Oficial nº 1/2004
- ↑ Candidate chosen to lead the Socialist list after the unexpected death of the former head of the list António Sousa Franco.
- ↑ The Social Democratic Party (PSD) and the People's Party (CDS–PP) contested separately the 1999 election.
- ↑ "Elecciones al Parlamento Europeo: Resultados por países 1979 - 2014". historiaelectoral.com (in Spanish). Retrieved 28 November 2017.

.jpg.webp)
.jpg.webp)
.jpg.webp)