| |||||||||||||||||||||||||||||||||||||||||||||||||||||||||||||||||||||||||||||
All 8 Latvian seats to the European Parliament | |||||||||||||||||||||||||||||||||||||||||||||||||||||||||||||||||||||||||||||
|---|---|---|---|---|---|---|---|---|---|---|---|---|---|---|---|---|---|---|---|---|---|---|---|---|---|---|---|---|---|---|---|---|---|---|---|---|---|---|---|---|---|---|---|---|---|---|---|---|---|---|---|---|---|---|---|---|---|---|---|---|---|---|---|---|---|---|---|---|---|---|---|---|---|---|---|---|---|
| Turnout | 30.14% | ||||||||||||||||||||||||||||||||||||||||||||||||||||||||||||||||||||||||||||
| |||||||||||||||||||||||||||||||||||||||||||||||||||||||||||||||||||||||||||||
An election of the delegation from Latvia to the European Parliament was held on 24 May 2014.
Background
At the previous European Parliament election in Latvia in 2009, the country elected 8 MEPs. Upon entry into force of the Lisbon Treaty Latvia was awarded 1 additional MEP, again bringing the total number of MEPs representing Latvia to 9. Calculated from the results of the 2009 election, this MEP came from the Civic Union. For this election however, the number of MEP's representing Latvia was again reduced to 8.[1]
Results
| Party | Votes | % | Seats | +/– | |
|---|---|---|---|---|---|
| Unity | 204,979 | 46.56 | 4 | 0 | |
| National Alliance | 63,229 | 14.36 | 1 | 0 | |
| Social Democratic Party "Harmony" | 57,863 | 13.14 | 1 | 0 | |
| Union of Greens and Farmers | 36,637 | 8.32 | 1 | +1 | |
| Latvian Russian Union | 28,303 | 6.43 | 1 | 0 | |
| Alternative | 16,566 | 3.76 | 0 | New | |
| Latvian Association of Regions | 11,035 | 2.51 | 0 | New | |
| For Latvia's Development | 9,421 | 2.14 | 0 | New | |
| Socialist Party of Latvia | 6,817 | 1.55 | 0 | New | |
| Latvian Social Democratic Workers' Party | 1,462 | 0.33 | 0 | 0 | |
| Christian Democratic Union | 1,453 | 0.33 | 0 | 0 | |
| Latvian Rebirth Party | 1,252 | 0.28 | 0 | 0 | |
| For a Presidential Republic | 672 | 0.15 | 0 | New | |
| Sovereignty | 599 | 0.14 | 0 | New | |
| Total | 440,288 | 100.00 | 8 | 0 | |
| Valid votes | 440,288 | 99.21 | |||
| Invalid/blank votes | 3,514 | 0.79 | |||
| Total votes | 443,802 | 100.00 | |||
| Registered voters/turnout | 1,472,478 | 30.14 | |||
| Source: CVK | |||||
Elected MEPs
| Name | National party | EP Group | Points[lower-alpha 1] |
|---|---|---|---|
| Valdis Dombrovskis | Unity | EPP | 346 821 |
| Sandra Kalniete | Unity | EPP | 277 124 |
| Artis Pabriks | Unity | EPP | 261 163 |
| Krišjānis Kariņš | Unity | EPP | 228 998 |
| Roberts Zīle | National Alliance | ECR | 99 937 |
| Andrejs Mamikins | Harmony | S&D | 84 953 |
| Iveta Grigule | Greens & Farmers | EFDD[lower-alpha 2] | 46 939 |
| Tatjana Ždanoka | Russian Union | G-EFA | 51 742 |
- ↑ Points are calculated from votes cast for a candidate's list minus 'crossings-out' and adding 'pluses' for individual candidates
- ↑ Iveta Grigule withdrew from the EFDD group on 16 October 2014 to become a Non-Attached Member. On 27 April 2015 she joined the Alliance of Liberals and Democrats for Europe Group.
Elected MEPs

 Sandra Kalniete (V)
.jpg.webp) Artis Pabriks (V)
Artis Pabriks (V)
.jpg.webp) Roberts Zīle (NA)
Roberts Zīle (NA) Andrejs Mamikins (S)
 Iveta Grigule (ZZS)
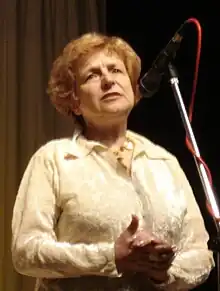
 Tatjana Ždanoka (LKS)
See also
References
- ↑ "How many MEPs will each country get after European Parliament elections in 2014?". European Parliament. 13 March 2013. Retrieved 1 September 2014.
External links
This article is issued from Wikipedia. The text is licensed under Creative Commons - Attribution - Sharealike. Additional terms may apply for the media files.


.jpg.webp)
