| |||||||||||||||||||||||||||||||||||||||||||||||||||||||||||||||||||||
All 32 Romanian seats in the European Parliament | |||||||||||||||||||||||||||||||||||||||||||||||||||||||||||||||||||||
|---|---|---|---|---|---|---|---|---|---|---|---|---|---|---|---|---|---|---|---|---|---|---|---|---|---|---|---|---|---|---|---|---|---|---|---|---|---|---|---|---|---|---|---|---|---|---|---|---|---|---|---|---|---|---|---|---|---|---|---|---|---|---|---|---|---|---|---|---|---|
| Turnout | 32.44%[1] | ||||||||||||||||||||||||||||||||||||||||||||||||||||||||||||||||||||
| |||||||||||||||||||||||||||||||||||||||||||||||||||||||||||||||||||||
 | |||||||||||||||||||||||||||||||||||||||||||||||||||||||||||||||||||||
The 2014 European Parliament election in Romania was held in Romania on 25 May 2014.[2]
Candidates and elected MEPs
- Corina Crețu
- Ecaterina Andronescu
- Cătălin Ivan
- Dan Nica
- Maria Grapini – PC
- Damian Drăghici – UNPR
- Daciana Sârbu
- Ioan-Mircea Pașcu
- Vasilica Dăncilă
- Ionel Moisă
- Victor Boștinaru
- Claudiu-Ciprian Tănăsescu
- Doru-Claudian Frunzulică – UNPR
- Constantin-Laurențiu Rebega – PC
- Ana-Claudia Țapardel
- Andi-Lucian Cristea
For the National Liberal Party (PNL):
For the Democratic Liberal Party (PDL):
- Theodor Stolojan
- Monica Macovei
- Traian Ungreanu
- Marian-Jean Marinescu
- Daniel Buda
Independent candidate:
For the Democratic Alliance of Hungarians in Romania (UDMR):
For the People's Movement Party (PMP):
Results

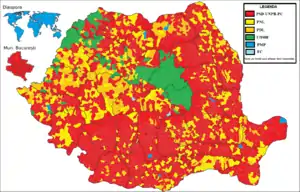
Largest party by county
| Party | Votes | % | Seats | +/– | |
|---|---|---|---|---|---|
| Social Democratic Union | 2,093,234 | 37.60 | 16 | +5 | |
| National Liberal Party | 835,531 | 15.01 | 6 | +1 | |
| Democratic Liberal Party | 680,853 | 12.23 | 5 | –5 | |
| Democratic Alliance of Hungarians in Romania | 350,689 | 6.30 | 2 | –1 | |
| People's Movement Party | 345,973 | 6.22 | 2 | New | |
| People's Party – Dan Diaconescu | 204,310 | 3.67 | 0 | New | |
| Greater Romania Party | 150,484 | 2.70 | 0 | –3 | |
| Civic Force | 145,181 | 2.61 | 0 | 0 | |
| Ecologist Party of Romania | 64,232 | 1.15 | 0 | New | |
| National Alliance of Farmers | 53,273 | 0.96 | 0 | New | |
| Christian Democratic National Peasants' Party | 49,983 | 0.90 | 0 | 0 | |
| Green Party | 19,148 | 0.34 | 0 | New | |
| New Republic | 15,419 | 0.28 | 0 | New | |
| Social Justice Party | 13,537 | 0.24 | 0 | New | |
| Socialist Alternative Party | 9,803 | 0.18 | 0 | New | |
| Independents | 534,966 | 9.61 | 1 | 0 | |
| Total | 5,566,616 | 100.00 | 32 | –1 | |
| Valid votes | 5,566,616 | 94.16 | |||
| Invalid/blank votes | 345,011 | 5.84 | |||
| Total votes | 5,911,627 | 100.00 | |||
| Registered voters/turnout | 18,221,061 | 32.44 | |||
| Source: ROAEP | |||||
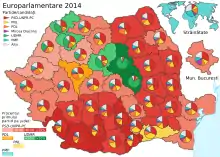
Results by county
| County | PSD | PNL | PDL | Mircea Diaconu | UDMR/RMDSZ | PMP | PP-DD | PRM | FC | PER |
|---|---|---|---|---|---|---|---|---|---|---|
| Alba | 27.54% | 17.15% | 27.61% | 4.85% | 3.39% | 5.39% | 2.67% | 2.13% | 1.88% | 1.27% |
| Arad | 26.83% | 12.38% | 24.74% | 5.65% | 7.62% | 4.24% | 5.45% | 2.19% | 2.30% | 0.83% |
| Argeș | 46.87% | 10.59% | 10.86% | 9.99% | 0.15% | 6.83% | 3.97% | 3.65% | 1.87% | 0.77% |
| Bacău | 45.85% | 17.40% | 7.78% | 5.76% | 0.38% | 5.92% | 4.05% | 2.50% | 2.90% | 2.36% |
| Bihor | 26.49% | 17.71% | 13.43% | 4.61% | 21.58% | 3.03% | 1.99% | 1.93% | 1.97% | 0.61% |
| Bistrița-Năsăud | 39.67% | 16.97% | 18.86% | 3.02% | 4.70% | 4.58% | 2.40% | 1.85% | 2.18% | 0.92% |
| Botoșani | 41.58% | 20.25% | 11.18% | 6.51% | 0.17% | 3.39% | 3.83% | 3.12% | 3.31% | 1.26% |
| Brașov | 30.44% | 14.05% | 15.62% | 9.80% | 6.89% | 5.24% | 2.08% | 2.47% | 4.31% | 2.52% |
| Brăila | 42.29% | 11.04% | 12.43% | 8.24% | 0.18% | 5.38% | 6.48% | 3.57% | 2.25% | 0.95% |
| București | 31.81% | 10.04% | 9.80% | 16.00% | 0.25% | 11.35% | 2.41% | 3.29% | 4.77% | 1.52% |
| Buzău | 41.52% | 22.40% | 8.19% | 6.81% | 0.13% | 5.77% | 4.37% | 3.79% | 1.22% | 0.92% |
| Caraș-Severin | 39.62% | 22.34% | 10.29% | 5.20% | 0.92% | 3.93% | 4.92% | 2.47% | 1.69% | 0.78% |
| Călărași | 32.55% | 34.93% | 11.70% | 4.66% | 0.08% | 3.83% | 4.35% | 2.07% | 1.13% | 0.57% |
| Cluj | 24.96% | 13.76% | 16.14% | 6.29% | 16.44% | 6.54% | 2.40% | 1.87% | 2.95% | 1.24% |
| Constanța | 34.48% | 14.75% | 10.49% | 9.54% | 0.19% | 11.18% | 4.25% | 3.29% | 4.10% | 1.37% |
| Covasna | 7.81% | 2.99% | 3.10% | 2.18% | 76.11% | 1.41% | 0.95% | 1.46% | 0.83% | 0.47% |
| Dâmbovița | 50.31% | 10.15% | 14.15% | 5.29% | 0.09% | 5.15% | 4.30% | 3.58% | 2.17% | 0.76% |
| Dolj | 55.99% | 9.39% | 14.93% | 5.09% | 0.10% | 4.67% | 3.17% | 2.02% | 1.26% | 0.46% |
| Galați | 46.51% | 16.99% | 7.77% | 6.78% | 0.21% | 6.19% | 4.72% | 2.31% | 2.12% | 1.17% |
| Giurgiu | 55.17% | 18.58% | 5.76% | 4.22% | 0.09% | 6.98% | 2.91% | 2.24% | 0.62% | 0.56% |
| Gorj | 43.89% | 13.74% | 11.84% | 5.40% | 0.42% | 5.23% | 8.20% | 5.11% | 1.90% | 0.65% |
| Harghita | 3.84% | 1.36% | 1.50% | 0.90% | 87.22% | 1.12% | 0.67% | 0.94% | 0.43% | 0.32% |
| Hunedoara | 37.00% | 21.59% | 7.43% | 7.60% | 3.85% | 4.99% | 3.81% | 3.62% | 2.65% | 0.93% |
| Ialomița | 47.25% | 13.75% | 11.17% | 6.42% | 0.11% | 5.39% | 4.50% | 3.65% | 1.40% | 0.72% |
| Iași | 37.57% | 16.94% | 8.91% | 7.15% | 0.13% | 5.72% | 4.19% | 2.62% | 9.08% | 1.22% |
| Ilfov | 36.31% | 29.47% | 8.63% | 5.83% | 0.09% | 6.56% | 2.48% | 2.27% | 2.18% | 0.80% |
| Maramureș | 34.86% | 16.98% | 12.03% | 5.79% | 6.21% | 7.59% | 3.82% | 2.87% | 1.52% | 1.80% |
| Mehedinți | 51.02% | 15.11% | 9.40% | 4.47% | 0.33% | 5.59% | 5.25% | 2.37% | 0.81% | 0.40% |
| Mureș | 20.74% | 11.40% | 8.14% | 4.35% | 40.26% | 3.27% | 2.09% | 3.17% | 1.81% | 0.71% |
| Neamț | 43.16% | 10.62% | 9.29% | 7.46% | 0.15% | 9.32% | 3.86% | 3.05% | 2.92% | 2.94% |
| Olt | 58.51% | 15.67% | 7.03% | 3.18% | 0.07% | 4.75% | 4.50% | 2.83% | 0.60% | 0.28% |
| Prahova | 33.06% | 16.78% | 17.17% | 7.75% | 0.12% | 7.29% | 4.19% | 3.22% | 2.62% | 1.13% |
| Satu Mare | 28.47% | 6.32% | 9.66% | 2.37% | 35.54% | 3.64% | 5.36% | 0.97% | 2.79% | 2.00% |
| Sălaj | 26.38% | 10.89% | 15.76% | 3.79% | 27.43% | 3.90% | 2.85% | 1.32% | 1.56% | 0.60% |
| Sibiu | 31.20% | 17.92% | 16.80% | 6.95% | 2.11% | 6.36% | 3.67% | 1.73% | 3.81% | 2.90% |
| Suceava | 40.13% | 9.77% | 23.07% | 6.33% | 0.34% | 4.48% | 3.03% | 2.95% | 1.66% | 1.10% |
| Teleorman | 47.97% | 22.85% | 12.21% | 3.55% | 0.07% | 3.93% | 3.36% | 2.06% | 0.71% | 0.37% |
| Timiș | 32.57% | 14.53% | 15.85% | 7.83% | 3.85% | 7.98% | 3.64% | 2.04% | 2.78% | 1.40% |
| Tulcea | 34.72% | 15.35% | 16.36% | 5.87% | 0.13% | 7.68% | 6.04% | 3.42% | 2.64% | 0.83% |
| Vaslui | 44.63% | 14.86% | 11.52% | 5.94% | 0.75% | 6.05% | 4.03% | 3.03% | 1.79% | 1.55% |
| Vâlcea | 40.91% | 20.56% | 12.79% | 6.03% | 0.38% | 5.57% | 3.27% | 3.42% | 2.06% | 0.58% |
| Vrancea | 46.1% | 15.94% | 10.25% | 5.40% | 0.09% | 7.14% | 4.90% | 2.45% | 2.41% | 0.84% |
| Diaspora | 11.05% | 8.69% | 15.72% | 6.38% | 1.23% | 28.64% | 5.49% | 2.21% | 6.47% | 3.86% |
References
External links
This article is issued from Wikipedia. The text is licensed under Creative Commons - Attribution - Sharealike. Additional terms may apply for the media files.


.jpg.webp)
.jpg.webp)

