| ||||||||||||||||||||||||||||||||||||||||||||||||||||||||||||||||||||
14 of the 42 seats to Basildon Borough Council 23 seats needed for a majority | ||||||||||||||||||||||||||||||||||||||||||||||||||||||||||||||||||||
|---|---|---|---|---|---|---|---|---|---|---|---|---|---|---|---|---|---|---|---|---|---|---|---|---|---|---|---|---|---|---|---|---|---|---|---|---|---|---|---|---|---|---|---|---|---|---|---|---|---|---|---|---|---|---|---|---|---|---|---|---|---|---|---|---|---|---|---|---|
| ||||||||||||||||||||||||||||||||||||||||||||||||||||||||||||||||||||
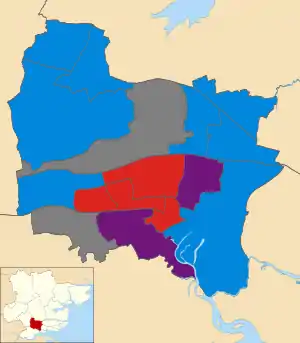
 Map showing the results of contested wards in the 2015 Basildon Borough Council elections. | ||||||||||||||||||||||||||||||||||||||||||||||||||||||||||||||||||||
| ||||||||||||||||||||||||||||||||||||||||||||||||||||||||||||||||||||
The 2015 Basildon Borough Council election took place on 7 May 2015, as part of the 2015 United Kingdom local elections, and took place alongside the UK General Election. One third of seats were up for election, with these seats last being contested in 2011. As a result of the election, the council remained in no overall control. The Conservative Party remained as the largest party, and formed a minority administration.
Results
| Party | Seats | Gains | Losses | Net gain/loss | Seats % | Votes % | Votes | +/− | |
|---|---|---|---|---|---|---|---|---|---|
| Conservative | 8 | 1 | 0 | 57.1 | 42.6 | 31,401 | |||
| Labour | 4 | 0 | 2 | 28.6 | 24.0 | 17,721 | |||
| UKIP | 2 | 2 | 1 | 14.3 | 28.4 | 20,987 | |||
| Liberal Democrats | 0 | 0 | 0 | 0 | 0 | 4.5 | 3,281 | ||
| Independent | 0 | 0 | 0 | 0 | 0 | 0.4 | 312 | ||
| TUSC | 0 | 0 | 0 | 0 | 0 | 0.1 | 97 | New | |
The turnout was 62.9%, and there were 376 ballots rejected. All comparisons in vote share are to the corresponding 2011 election.
Council Composition
Following the 2014 election, the composition of the council was:
| 17 | 12 | 9 | 3 | 1 |
| Conservative | UKIP | Labour | IND | L |
On the eve on the 2015 election, the composition of the council was:
| 17 | 10 | 9 | 3 | 2 | 1 |
| Conservative | UKIP | Labour | IND | IG | L |
After the election, the composition of the council was:
| 18 | 11 | 9 | 2 | 1 |
| Conservative | UKIP | Labour | IG | L |
IND - Independent
IG - Independence Group
L - Liberal Democrats
Ward Results
An asterisk denotes an incumbent councillor seeking re-election.
Billericay East

| Party | Candidate | Votes | % | ±% | |
|---|---|---|---|---|---|
| Conservative | David John Dadds* | 4,085 | 60.6 | -4.0 | |
| UKIP | Herbert John Webb | 1,076 | 16.0 | +7.5 | |
| Labour | Patricia Reid | 878 | 13.0 | -0.9 | |
| Liberal Democrats | Nigel John Horn | 704 | 10.4 | -2.6 | |
| Majority | 3,009 | 44.6 | |||
| Turnout | 6,743 | 74.0 | +29.8 | ||
| Conservative hold | Swing | ||||
Billericay West

| Party | Candidate | Votes | % | ±% | |
|---|---|---|---|---|---|
| Conservative | Daniel Lawrence | 4,419 | 64.2 | +4.9 | |
| UKIP | Susan Patricia McCaffery | 1,066 | 15.5 | -0.8 | |
| Labour | Andrew James Ansell | 978 | 14.2 | -0.1 | |
| Liberal Democrats | Alan Henry Richards | 421 | 6.1 | -3.9 | |
| Majority | 3,353 | 48.7 | |||
| Turnout | 6,884 | 74.0 | +30.6 | ||
| Conservative hold | Swing | ||||
Burstead

| Party | Candidate | Votes | % | ±% | |
|---|---|---|---|---|---|
| Conservative | Kevin Blake* | 3,898 | 62.4 | -0.5 | |
| UKIP | Paul John Downes | 1,156 | 18.5 | +8.6 | |
| Labour | David Thomas Kirkman | 828 | 13.3 | -3.3 | |
| Liberal Democrats | Ben Williams | 362 | 5.8 | -4.8 | |
| Majority | 43.9 | 2,742 | |||
| Turnout | 6,244 | 73.0 | +29.4 | ||
| Conservative hold | Swing | ||||
Fryerns

| Party | Candidate | Votes | % | ±% | |
|---|---|---|---|---|---|
| Labour | Allan Robert Davies* | 1,832 | 33.6 | 6.0 | |
| UKIP | Cliff Hammans | 1,749 | 32.1 | +24.7 | |
| Conservative | Sandra Elizabeth Hillier | 1,638 | 30.1 | +13.8 | |
| Liberal Democrats | Colin Stanley Grant | 169 | 3.1 | +2.3 | |
| TUSC | David James John Murray | 58 | 1.1 | N/A | |
| Majority | 83 | 1.5 | |||
| Turnout | 5,446 | 57.0 | +26.9 | ||
| Labour hold | Swing | ||||
Laindon Park

| Party | Candidate | Votes | % | ±% | |
|---|---|---|---|---|---|
| Conservative | Andrew James Barnes | 1,871 | 35.2 | -13.9 | |
| UKIP | Anne Marie Waters | 1,668 | 31.4 | N/A | |
| Labour | Stephen Gillan | 1,408 | 26.5 | -16.9 | |
| Liberal Democrats | John Francis Barnes-Challinor | 226 | 4.3 | -3.2 | |
| Independent | Patricia Ann Rackley | 136 | 2.6 | N/A | |
| Majority | 203 | 3.8 | |||
| Turnout | 5,309 | 60.0 | +27.7 | ||
| Conservative hold | Swing | ||||
Lee Chapel North

| Party | Candidate | Votes | % | ±% | |
|---|---|---|---|---|---|
| Labour | Alan Bennett | 1,895 | 37.4 | -17.5 | |
| UKIP | Arthur John James | 1,825 | 36.0 | N/A | |
| Conservative | Nicole Carrie Schrader | 1,131 | 22.3 | -2.4 | |
| Liberal Democrats | Steve Nice | 215 | 4.3 | -2.4 | |
| Majority | 70 | 1.4 | |||
| Turnout | 5,066 | 55.0 | +25.8 | ||
| Labour hold | Swing | ||||
Nethermayne

| Party | Candidate | Votes | % | ±% | |
|---|---|---|---|---|---|
| UKIP | Stephen Michael Hodge | 1,700 | 29.9 | +9.7 | |
| Conservative | Mark Anthony Coker | 1,674 | 29.4 | +6.3 | |
| Labour | Andrew Forrest Gordon* | 1,518 | 26.7 | -3.5 | |
| Liberal Democrats | Phil Jenkins | 618 | 10.9 | -13.6 | |
| Independent | Pauline Patricia Kettle | 176 | 3.1 | N/A | |
| Majority | 26 | 0.5 | |||
| Turnout | 5,686 | 64.0 | +29.1 | ||
| UKIP gain from Labour | Swing | ||||
Pitsea North West

| Party | Candidate | Votes | % | ±% | |
|---|---|---|---|---|---|
| UKIP | Gary Canham | 1,731 | 35.2 | +18.5 | |
| Labour | Keith Bobbin* | 1,611 | 32.8 | -14.5 | |
| Conservative | Ian David Dwyer | 1,424 | 29.0 | -0.9 | |
| Liberal Democrats | Martin Keith Howard | 149 | 3.0 | -3.1 | |
| Majority | 120 | 2.4 | |||
| Turnout | 4,915 | 54.0 | +28.5 | ||
| UKIP gain from Labour | Swing | ||||
Pitsea South East

| Party | Candidate | Votes | % | ±% | |
|---|---|---|---|---|---|
| Conservative | Amanda Louise Arnold | 1,841 | 35.2 | -8.4 | |
| UKIP | Jose Carrion | 1,637 | 31.3 | +17.3 | |
| Labour | David Edmund Burton-Sampson | 1,572 | 30.1 | -8.3 | |
| Liberal Democrats | Vivien Jennifer Howard | 177 | 3.4 | -0.6 | |
| Majority | 204 | 3.9 | |||
| Turnout | 5,227 | 60.0 | +27.7 | ||
| Conservative hold | Swing | ||||
St Martin's

| Party | Candidate | Votes | % | ±% | |
|---|---|---|---|---|---|
| Labour | Andrew Charles Buxton | 1,393 | 41.1 | -16.7 | |
| UKIP | Andrew Robert Morris | 955 | 28.2 | N/A | |
| Conservative | Stephanie Lucinda Hedley-Barnes | 910 | 26.9 | -5.1 | |
| Liberal Democrats | Liz Grant | 130 | 3.8 | -6.4 | |
| Majority | 438 | 12.9 | |||
| Turnout | 3,388 | 56.0 | +26.5 | ||
| Labour hold | Swing | ||||
Vange

| Party | Candidate | Votes | % | ±% | |
|---|---|---|---|---|---|
| Labour | Melissa Anne McGeorge | 1,289 | 36.0 | -16.3 | |
| UKIP | Michel May | 1,136 | 31.7 | +15.5 | |
| Conservative | Tony Ball | 1,009 | 28.2 | +1.6 | |
| Liberal Democrats | Linda Mary Williams | 110 | 3.0 | -1.9 | |
| TUSC | Samuel James Bennett | 39 | 1.1 | N/A | |
| Majority | 153 | 4.3 | |||
| Turnout | 3,583 | 53.0 | +27.3 | ||
| Labour hold | Swing | ||||
Wickford Castledon

| Party | Candidate | Votes | % | ±% | |
|---|---|---|---|---|---|
| Conservative | Don Morris | 2,018 | 48.2 | -11.5 | |
| UKIP | Nigel de Lecq Le Gresley | 1,529 | 36.5 | N/A | |
| Labour | Jenefer Anne Taylor | 641 | 15.3 | -1.2 | |
| Majority | 489 | 11.7 | |||
| Turnout | 4,188 | 68.0 | 29.1 | ||
| Conservative hold | Swing | ||||
Note: The ward had been won by the Conservatives at the last regular election in 2011, but gained by UKIP in a by-election in 2013.[13]
Wickford North

| Party | Candidate | Votes | % | ±% | |
|---|---|---|---|---|---|
| Conservative | Michael Owen Mowe* | 3,128 | 47.7 | -6.4 | |
| UKIP | Eunice Christine Brockman | 2,285 | 34.8 | N/A | |
| Labour | Albert Edward Ede | 1,147 | 17.5 | +0.9 | |
| Majority | 843 | 12.7 | |||
| Turnout | 6,560 | 67.0 | +29.1 | ||
| Conservative hold | Swing | ||||
Wickford Park

| Party | Candidate | Votes | % | ±% | |
|---|---|---|---|---|---|
| Conservative | Chris Jackman* | 2,355 | 51.7 | -17.1 | |
| UKIP | Derek Harrison | 1,474 | 32.3 | N/A | |
| Labour | Matthew Martin Whaley | 731 | 16.0 | -4.9 | |
| Majority | 881 | 19.4 | |||
| Turnout | 4,560 | 55.0 | +22.9 | ||
| Conservative hold | Swing | ||||
References
- ↑ "Basildon Council - Election results for Billericay East, 7 May 2015". basildonmeetings.info. Retrieved 4 August 2016.
- ↑ "Basildon Council - Election results for Billericay West, 7 May 2015". basildonmeetings.info. Retrieved 4 August 2016.
- ↑ "Basildon Council - Election results for Burstead, 7 May 2015". basildonmeetings.info. Retrieved 4 August 2016.
- ↑ "Basildon Council - Election results for Fryerns, 7 May 2015". basildonmeetings.info. Retrieved 4 August 2016.
- ↑ "Basildon Council - Election results for Laindon Park, 7 May 2015". basildonmeetings.info. Retrieved 4 August 2016.
- ↑ "Basildon Council - Election results for Lee Chapel North, 7 May 2015". basildonmeetings.info. Retrieved 4 August 2016.
- ↑ "Basildon Council - Election results for Nethermayne, 7 May 2015". basildonmeetings.info. Retrieved 4 August 2016.
- ↑ "Basildon Council - Election results for Pitsea North West, 7 May 2015". basildonmeetings.info. Retrieved 4 August 2016.
- ↑ "Basildon Council - Election results for Pitsea South East, 7 May 2015". basildonmeetings.info. Retrieved 4 August 2016.
- ↑ "Basildon Council - Election results for St Martin's, 7 May 2015". basildonmeetings.info. Retrieved 4 August 2016.
- ↑ "Basildon Council - Election results for Vange, 7 May 2015". basildonmeetings.info. Retrieved 4 August 2016.
- ↑ "Basildon Council - Election results for Wickford Castledon, 7 May 2015". basildonmeetings.info. 7 May 2015. Retrieved 4 August 2016.
- ↑ "Election results for Wickford Castledon, 2 May 2013". www.basildonmeetings.info. 2 May 2013.
- ↑ "Basildon Council - Election results for Wickford North, 7 May 2015". basildonmeetings.info. 7 May 2015. Retrieved 4 August 2016.
- ↑ "Basildon Council - Election results for Wickford Park, 7 May 2015". basildonmeetings.info. 7 May 2015. Retrieved 4 August 2016.