| ||||||||||||||||||||||||||
| Turnout | 69.75% | |||||||||||||||||||||||||
|---|---|---|---|---|---|---|---|---|---|---|---|---|---|---|---|---|---|---|---|---|---|---|---|---|---|---|
| ||||||||||||||||||||||||||

| ||||||||||||||||||||||||||
| ||||||||||||||||||||||||||
.jpg.webp)
.jpg.webp)
| Elections in Missouri |
|---|
 |
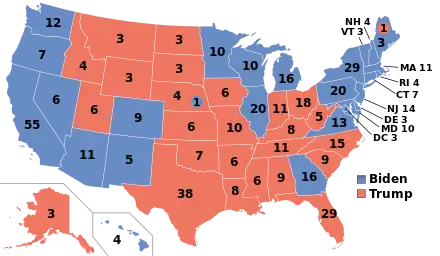
The 2020 United States presidential election in Missouri was held on Tuesday, November 3, 2020, as part of the 2020 United States presidential election in which all 50 states plus the District of Columbia participated.[1] Missouri voters chose electors to represent them in the Electoral College via a popular vote, pitting the Republican Party's nominee, incumbent President Donald Trump of Florida, and running mate Vice President Mike Pence of Indiana against Democratic Party nominee, former Vice President Joe Biden of Delaware, and his running mate Senator Kamala Harris of California. Missouri has 10 electoral votes in the Electoral College.[2]
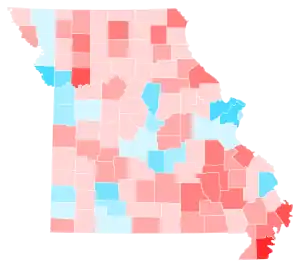
Trump won Missouri again by a 15.4% margin. This was 3.1% lower than his 2016 margin, but still a better performance in the state than that of any other Republican nominee since Ronald Reagan in 1984. Prior to the election, most news organizations considered this a state Trump would win; during the 21st century Missouri has shifted away from being one of the most notable bellwether states towards becoming a solidly red state. Trump became the first incumbent president since Grover Cleveland in 1888 to win Missouri and lose re-election and the first-ever Republican incumbent to do so. This is also the first time since 1916 (and only the second time ever) that Missouri has voted more Republican than neighboring Kansas.
In this election, Missouri voted just under 20% to the right of the nation as a whole.
Primary elections
Democratic primary
.svg.png.webp)
| Candidate | Votes | % | Delegates[4] |
|---|---|---|---|
| Joe Biden | 400,347 | 60.10 | 44 |
| Bernie Sanders | 230,374 | 34.59 | 24 |
| Michael Bloomberg (withdrawn) | 9,866 | 1.48 | |
| Elizabeth Warren (withdrawn) | 8,156 | 1.22 | |
| Tulsi Gabbard | 4,887 | 0.73 | |
| Pete Buttigieg (withdrawn) | 3,309 | 0.50 | |
| Amy Klobuchar (withdrawn) | 2,682 | 0.40 | |
| Andrew Yang (withdrawn) | 953 | 0.14 | |
| Cory Booker (withdrawn) | 651 | 0.10 | |
| Tom Steyer (withdrawn) | 584 | 0.09 | |
| Michael Bennet (withdrawn) | 206 | 0.03 | |
| Marianne Williamson (withdrawn) | 170 | 0.03 | |
| John Delaney (withdrawn) | 159 | 0.02 | |
| Julian Castro (withdrawn) | 103 | 0.02 | |
| Henry Hewes | 94 | 0.01 | |
| Deval Patrick (withdrawn) | 52 | 0.01 | |
| Other candidates | 1,025 | 0.15 | |
| Uncommitted | 2,494 | 0.37 | |
| Total | 666,112 | 100% | 68 |
Republican primary
| Candidate | Votes | % | Estimated delegates |
|---|---|---|---|
| Donald Trump | 301,600 | 96.8% | 54 |
| Uncommitted | 4,176 | 1.4% | 0 |
| Bill Weld | 2,148 | 0.7% | 0 |
| Joe Walsh (withdrawn) | 2,002 | 0.6% | 0 |
| Bob Ely | 847 | 0.3% | 0 |
| Matthew John Matern | 607 | 0.2% | 0 |
| Total | 311,793 | 100% | 54 |
Libertarian primary
| ||||||||||||||||
| ||||||||||||||||
 Election results by county
| ||||||||||||||||
_(3).jpg.webp)
| Candidate | Votes | Percentage |
|---|---|---|
| Jacob Hornberger | 1,683 | 74.6% |
| Uncommitted | 573 | 25.4% |
| Total | 2,256 | 100% |
Green primary
| Party | Candidate | Votes | % | |
|---|---|---|---|---|
| Green | Howie Hawkins | 2,733 | 76.93% | |
| Green | Dario Hunter | 639 | 26.87% | |
| Green | David Rolde | 214 | 10.99% | |
| Total votes | 3,586 | 100% | ||
General election
Predictions
| Source | Ranking | As of |
|---|---|---|
| The Cook Political Report[8] | Likely R | September 10, 2020 |
| Inside Elections[9] | Lean R | September 4, 2020 |
| Sabato's Crystal Ball[10] | Likely R | July 14, 2020 |
| Politico[11] | Safe R | September 8, 2020 |
| RCP[12] | Lean R | August 3, 2020 |
| Niskanen[13] | Safe R | July 26, 2020 |
| CNN[14] | Safe R | August 3, 2020 |
| The Economist[15] | Likely R | September 2, 2020 |
| CBS News[16] | Likely R | August 16, 2020 |
| 270towin[17] | Likely R | August 2, 2020 |
| ABC News[18] | Lean R | July 31, 2020 |
| NPR[19] | Likely R | August 3, 2020 |
| NBC News[20] | Likely R | August 6, 2020 |
| 538[21] | Likely R | September 9, 2020 |
Polling
- Graphical summary
Aggregate polls
| Source of poll aggregation |
Dates administered |
Dates updated |
Joe Biden Democratic |
Donald Trump Republican |
Other/ Undecided [lower-alpha 1] |
Margin |
|---|---|---|---|---|---|---|
| 270 to Win | October 13 – November 2, 2020 | November 3, 2020 | 43.7% | 51.3% | 5.0% | Trump +7.6 |
| FiveThirtyEight | until November 2, 2020 | November 3, 2020 | 43.6% | 51.6% | 4.8% | Trump +8.0 |
| Average | 43.7% | 51.5% | 4.9% | Trump +7.8 | ||
Polls
| Poll source | Date(s) administered |
Sample size[lower-alpha 2] |
Margin of error |
Donald Trump Republican |
Joe Biden Democratic |
Jo Jorgensen Libertarian |
Howie Hawkins Green |
Other | Undecided |
|---|---|---|---|---|---|---|---|---|---|
| SurveyMonkey/Axios | Oct 20 – Nov 2, 2020 | 2,926 (LV) | ± 2.5% | 54%[lower-alpha 3] | 44% | - | - | – | – |
| Swayable Archived November 27, 2020, at the Wayback Machine | Oct 23 – Nov 1, 2020 | 487 (LV) | ± 6.6% | 55% | 43% | 2% | 0% | – | – |
| Morning Consult | Oct 22–31, 2020 | 1,109 (LV) | ± 3% | 52% | 43% | - | - | – | – |
| Remington Research Group/Missouri Scout | Oct 28–29, 2020 | 1,010 (LV) | ± 3% | 50% | 45% | 2% | 1% | – | 2% |
| SurveyMonkey/Axios | Oct 1–28, 2020 | 4,759 (LV) | – | 53% | 45% | - | - | – | – |
| Remington Research Group/Missouri Scout | Oct 14–15, 2020 | 1,010 (LV) | ± 3% | 51% | 45% | 1% | 1% | - | 2% |
| YouGov/SLU | Sep 24 – Oct 7, 2020 | 931 (LV) | ± 3.9% | 52% | 43% | - | - | 3% | 2% |
| Garin-Hart-Yang/Galloway for Missouri[upper-alpha 1] | Sep 28 – Oct 2, 2020 | 600 (LV) | ± 4.1% | 50% | 48% | - | - | – | – |
| Remington Research Group/Missouri Scout | Sep 30 – Oct 1, 2020 | 980 (LV) | ± 3% | 51% | 46% | - | - | – | 3% |
| SurveyMonkey/Axios | Sep 1–30, 2020 | 2,157 (LV) | – | 53% | 45% | - | - | – | 2% |
| Remington Research Group/Missouri Scout | Sep 16–17, 2020 | 1,046 (LV) | ± 3% | 53% | 45% | - | - | – | 2% |
| We Ask America | Sep 1–3, 2020 | 500 (LV) | ± 4.38% | 49% | 44% | - | - | 5%[lower-alpha 4] | 2% |
| SurveyMonkey/Axios | Aug 1–31, 2020 | 1,863 (LV) | – | 54% | 44% | - | - | – | 2% |
| Trafalgar Group (R) | Aug 26–28, 2020 | 1,015 (LV) | ± 2.99% | 52% | 41% | 3% | - | 1%[lower-alpha 5] | 3% |
| SurveyMonkey/Axios | Jul 1–31, 2020 | 2,261 (LV) | – | 54% | 44% | - | - | – | 2% |
| YouGov/Saint Louis University | Jun 23 – Jul 1, 2020 | 900 (LV) | ± 3.95% | 50% | 43% | - | - | 4% | 4% |
| SurveyMonkey/Axios | Jun 8–30, 2020 | 868 (LV) | – | 51% | 47% | - | - | – | 1% |
| Garin-Hart-Yang/Galloway for Governor/Missouri Scout[upper-alpha 1] | Jun 16–22, 2020 | 800 (LV) | ± 3.5% | 46% | 48% | - | - | – | – |
| Remington Research Group/Missouri Scout | Jun 10–11, 2020 | 1,152 (LV) | ± 2.9% | 51% | 43% | - | - | – | 6% |
| We Ask America | May 26–27, 2020 | 500 (LV) | ± 4.38% | 48% | 44% | - | - | 3%[lower-alpha 6] | 5% |
| Remington Research Group/Missouri Scout | Feb 26–27, 2020 | 1,050 (LV) | – | 53% | 42% | - | - | – | 5% |
| American Viewpoint/Uniting Missouri[upper-alpha 2] | Jan 20–22, 2020 | 1,200 (LV) | – | 50% | 43% | - | - | – | 7% |
| Remington Research Group | Sep 18–19, 2019 | 1,046 (LV) | ± 3.0% | 53% | 42% | - | - | – | 5% |
| Remington Research Group | Apr 10–11, 2019 | 955 (LV) | ± 3.3% | 51% | 43% | - | - | – | 6% |
Former candidates | |||||||||||||||||||||||||||||||||||||||||||||||||||||||||||||||||||||||||||||||||||||||||||||||||||||||||||||||||||||||
|---|---|---|---|---|---|---|---|---|---|---|---|---|---|---|---|---|---|---|---|---|---|---|---|---|---|---|---|---|---|---|---|---|---|---|---|---|---|---|---|---|---|---|---|---|---|---|---|---|---|---|---|---|---|---|---|---|---|---|---|---|---|---|---|---|---|---|---|---|---|---|---|---|---|---|---|---|---|---|---|---|---|---|---|---|---|---|---|---|---|---|---|---|---|---|---|---|---|---|---|---|---|---|---|---|---|---|---|---|---|---|---|---|---|---|---|---|---|---|---|
|
Donald Trump vs. Michael Bloomberg
Donald Trump vs. Pete Buttigieg
Donald Trump vs. Kamala Harris
Donald Trump vs. Beto O'Rourke
Donald Trump vs. Bernie Sanders
Donald Trump vs. Elizabeth Warren
|
Hypothetical polling | ||||||||||||||
|---|---|---|---|---|---|---|---|---|---|---|---|---|---|---|
|
Results
| Party | Candidate | Votes | % | ±% | |
|---|---|---|---|---|---|
| Republican | Donald Trump Mike Pence |
1,718,736 | 56.80 | +0.02 | |
| Democratic | Joe Biden Kamala Harris |
1,253,014 | 41.41 | +3.27 | |
| Libertarian | Jo Jorgensen Spike Cohen |
41,205 | 1.36 | -2.11 | |
| Green | Howie Hawkins Angela Walker |
8,283 | 0.27 | -0.63 | |
| Constitution | Don Blankenship William Mohr |
3,919 | 0.13 | -0.34 | |
| Write-in | 805 | 0.03 | n/a | ||
| Total votes | 3,025,962 | 100.00 | |||
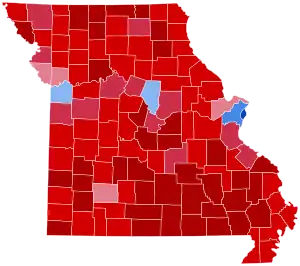
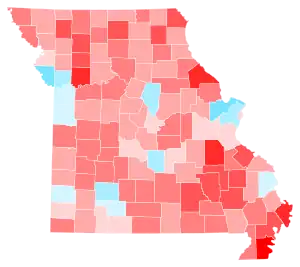
By county
| County | Joseph R. Biden
Democratic |
Donald J. Trump
Republican |
Other | Margin | Total Votes | ||||
|---|---|---|---|---|---|---|---|---|---|
| # | % | # | % | # | % | # | % | # | |
| Adair | 3,710 | 35.89% | 6,413 | 62.05% | 213 | 2.06% | 2,703 | 26.15% | 10,336 |
| Andrew | 2,351 | 24.11% | 7,255 | 74.39% | 146 | 1.50% | 4,904 | 50.29% | 9,752 |
| Atchison | 564 | 20.04% | 2,199 | 78.14% | 51 | 1.81% | 1,635 | 58.10% | 2,814 |
| Audrain | 2,704 | 25.38% | 7,732 | 72.56% | 220 | 2.06% | 5,028 | 47.18% | 10,656 |
| Barry | 2,948 | 18.90% | 12,425 | 79.66% | 225 | 1.44% | 9,477 | 60.76% | 15,598 |
| Barton | 844 | 13.89% | 5,168 | 85.04% | 65 | 1.07% | 4,324 | 71.15% | 6,077 |
| Bates | 1,672 | 19.87% | 6,597 | 78.39% | 147 | 1.75% | 4,925 | 58.52% | 8,416 |
| Benton | 2,180 | 20.81% | 8,109 | 77.41% | 187 | 1.79% | 5,929 | 56.60% | 10,476 |
| Bollinger | 750 | 12.54% | 5,167 | 86.36% | 66 | 1.10% | 4,417 | 73.83% | 5,983 |
| Boone | 50,064 | 54.91% | 38,646 | 42.39% | 2,458 | 2.70% | -11,418 | -12.52% | 91,168 |
| Buchanan | 13,445 | 36.74% | 22,450 | 61.34% | 703 | 1.92% | 9,005 | 24.61% | 36,598 |
| Butler | 3,301 | 18.20% | 14,602 | 80.49% | 238 | 1.31% | 11,301 | 62.30% | 18,141 |
| Caldwell | 897 | 19.16% | 3,725 | 79.56% | 60 | 1.28% | 2,828 | 60.40% | 4,682 |
| Callaway | 5,870 | 27.76% | 14,815 | 70.07% | 459 | 2.17% | 8,945 | 42.31% | 21,144 |
| Camden | 5,652 | 22.78% | 18,850 | 75.97% | 310 | 1.25% | 13,198 | 53.19% | 24,812 |
| Cape Girardeau | 10,760 | 26.68% | 28,907 | 71.68% | 661 | 1.64% | 18,147 | 45.00% | 40,328 |
| Carroll | 786 | 17.34% | 3,706 | 81.77% | 40 | 0.88% | 2,920 | 64.43% | 4,532 |
| Carter | 418 | 14.43% | 2,451 | 84.60% | 28 | 0.97% | 2,033 | 70.18% | 2,897 |
| Cass | 19,052 | 33.19% | 37,197 | 64.79% | 1,159 | 2.02% | 18,145 | 31.61% | 57,408 |
| Cedar | 1,145 | 16.25% | 5,788 | 82.17% | 111 | 1.58% | 4,643 | 65.91% | 7,044 |
| Chariton | 916 | 22.47% | 3,111 | 76.31% | 50 | 1.23% | 2,195 | 53.84% | 4,077 |
| Christian | 11,131 | 23.76% | 34,920 | 74.55% | 788 | 1.68% | 23,789 | 50.79% | 46,839 |
| Clark | 678 | 19.98% | 2,672 | 78.73% | 44 | 1.30% | 1,994 | 58.75% | 3,394 |
| Clay | 59,400 | 46.93% | 64,605 | 51.04% | 2,564 | 2.03% | 5,205 | 4.11% | 126,569 |
| Clinton | 2,896 | 26.60% | 7,799 | 71.63% | 193 | 1.77% | 4,903 | 45.03% | 10,888 |
| Cole | 12,694 | 32.11% | 26,086 | 65.99% | 749 | 1.89% | 13,392 | 33.88% | 39,529 |
| Cooper | 2,249 | 25.87% | 6,272 | 72.15% | 172 | 1.98% | 4,023 | 46.28% | 8,693 |
| Crawford | 2,113 | 19.26% | 8,725 | 79.51% | 135 | 1.23% | 6,612 | 60.26% | 10,973 |
| Dade | 656 | 15.93% | 3,414 | 82.88% | 49 | 1.19% | 2,758 | 66.96% | 4,119 |
| Dallas | 1,380 | 17.03% | 6,619 | 81.68% | 105 | 1.30% | 5,239 | 64.65% | 8,104 |
| Daviess | 746 | 19.07% | 3,102 | 79.31% | 63 | 1.61% | 2,356 | 60.24% | 3,911 |
| DeKalb | 930 | 19.20% | 3,828 | 79.04% | 85 | 1.76% | 2,898 | 59.84% | 4,843 |
| Dent | 1,056 | 14.79% | 5,987 | 83.83% | 99 | 1.39% | 4,931 | 69.04% | 7,142 |
| Douglas | 1,016 | 14.51% | 5,898 | 84.26% | 86 | 1.23% | 4,882 | 69.74% | 7,000 |
| Dunklin | 2,200 | 21.12% | 8,135 | 78.08% | 84 | 0.81% | 5,935 | 56.96% | 10,419 |
| Franklin | 14,569 | 27.14% | 38,058 | 70.89% | 1,058 | 1.97% | 23,489 | 43.75% | 53,685 |
| Gasconade | 1,601 | 20.21% | 6,222 | 78.53% | 100 | 1.26% | 4,621 | 58.32% | 7,923 |
| Gentry | 613 | 18.94% | 2,581 | 79.73% | 43 | 1.33% | 1,968 | 60.80% | 3,237 |
| Greene | 55,068 | 38.83% | 83,630 | 58.98% | 3,102 | 2.19% | 28,562 | 20.14% | 141,800 |
| Grundy | 799 | 18.01% | 3,585 | 80.80% | 53 | 1.19% | 2,786 | 62.79% | 4,437 |
| Harrison | 597 | 15.60% | 3,198 | 83.59% | 31 | 0.81% | 2,601 | 67.98% | 3,826 |
| Henry | 2,619 | 24.28% | 8,027 | 74.41% | 142 | 1.32% | 5,408 | 50.13% | 10,788 |
| Hickory | 1,056 | 20.79% | 3,966 | 78.07% | 58 | 1.14% | 2,910 | 57.28% | 5,080 |
| Holt | 338 | 14.43% | 1,976 | 84.34% | 29 | 1.24% | 1,638 | 69.91% | 2,343 |
| Howard | 1,413 | 27.75% | 3,553 | 69.78% | 126 | 2.47% | 2,140 | 42.03% | 5,092 |
| Howell | 3,218 | 17.25% | 15,181 | 81.40% | 251 | 1.35% | 11,963 | 64.14% | 18,650 |
| Iron | 945 | 20.58% | 3,596 | 78.31% | 51 | 1.11% | 2,651 | 57.73% | 4,592 |
| Jackson | 199,842 | 60.00% | 126,535 | 37.99% | 6,686 | 2.01% | -73,307 | -22.01% | 333,063 |
| Jasper | 13,549 | 25.88% | 37,728 | 72.07% | 1,075 | 2.05% | 24,179 | 46.19% | 52,352 |
| Jefferson | 37,523 | 32.16% | 77,046 | 66.03% | 2,119 | 1.82% | 39,523 | 33.87% | 116,688 |
| Johnson | 6,974 | 30.16% | 15,489 | 66.99% | 660 | 2.85% | 8,515 | 36.82% | 23,123 |
| Knox | 340 | 18.34% | 1,486 | 80.15% | 28 | 1.51% | 1,146 | 61.81% | 1,854 |
| Laclede | 2,780 | 16.55% | 13,762 | 81.95% | 251 | 1.49% | 10,982 | 65.40% | 16,793 |
| Lafayette | 4,472 | 26.22% | 12,273 | 71.96% | 310 | 1.82% | 7,801 | 45.74% | 17,055 |
| Lawrence | 3,214 | 17.95% | 14,426 | 80.57% | 265 | 1.48% | 11,212 | 62.62% | 17,905 |
| Lewis | 984 | 21.35% | 3,553 | 77.09% | 72 | 1.56% | 2,569 | 55.74% | 4,609 |
| Lincoln | 6,607 | 22.77% | 21,848 | 75.29% | 563 | 1.94% | 15,241 | 52.52% | 29,018 |
| Linn | 1,275 | 22.27% | 4,363 | 76.20% | 88 | 1.54% | 3,088 | 53.93% | 5,726 |
| Livingston | 1,410 | 20.86% | 5,267 | 77.94% | 81 | 1.20% | 3,857 | 57.07% | 6,758 |
| Macon | 1,662 | 21.21% | 6,076 | 77.54% | 98 | 1.25% | 4,414 | 56.33% | 7,836 |
| Madison | 1,019 | 17.95% | 4,584 | 80.76% | 73 | 1.29% | 3,565 | 62.81% | 5,676 |
| Maries | 814 | 17.06% | 3,892 | 81.58% | 65 | 1.36% | 3,078 | 64.51% | 4,771 |
| Marion | 3,202 | 23.99% | 9,915 | 74.28% | 231 | 1.73% | 6,713 | 50.29% | 13,348 |
| McDonald | 1,439 | 15.90% | 7,465 | 82.46% | 149 | 1.65% | 6,026 | 66.56% | 9,053 |
| Mercer | 222 | 12.48% | 1,541 | 86.62% | 16 | 0.90% | 1,319 | 74.14% | 1,779 |
| Miller | 2,038 | 16.46% | 10,176 | 82.18% | 168 | 1.36% | 8,138 | 65.72% | 12,382 |
| Mississippi | 1,178 | 24.77% | 3,537 | 74.37% | 41 | 0.86% | 2,359 | 49.60% | 4,756 |
| Moniteau | 1,308 | 18.28% | 5,744 | 80.26% | 105 | 1.47% | 4,436 | 61.98% | 7,157 |
| Monroe | 936 | 20.88% | 3,477 | 77.56% | 70 | 1.56% | 2,541 | 56.68% | 4,483 |
| Montgomery | 1,208 | 20.93% | 4,465 | 77.36% | 99 | 1.72% | 3,257 | 56.43% | 5,772 |
| Morgan | 1,924 | 20.28% | 7,442 | 78.44% | 121 | 1.28% | 5,518 | 58.16% | 9,487 |
| New Madrid | 1,748 | 24.11% | 5,447 | 75.13% | 55 | 0.76% | 3,699 | 51.02% | 7,250 |
| Newton | 5,818 | 20.48% | 22,120 | 77.87% | 467 | 1.64% | 16,302 | 57.39% | 28,405 |
| Nodaway | 2,853 | 28.84% | 6,865 | 69.39% | 175 | 1.77% | 4,012 | 40.55% | 9,893 |
| Oregon | 823 | 17.37% | 3,847 | 81.18% | 69 | 1.46% | 3,024 | 63.81% | 4,739 |
| Osage | 1,037 | 13.76% | 6,425 | 85.22% | 77 | 1.02% | 5,388 | 71.47% | 7,539 |
| Ozark | 752 | 15.46% | 4,064 | 83.55% | 48 | 0.99% | 3,312 | 68.09% | 4,864 |
| Pemiscot | 1,560 | 27.20% | 4,120 | 71.84% | 55 | 0.96% | 2,560 | 44.64% | 5,735 |
| Perry | 1,664 | 17.61% | 7,657 | 81.05% | 126 | 1.33% | 5,993 | 63.44% | 9,447 |
| Pettis | 4,783 | 25.05% | 13,854 | 72.55% | 460 | 2.41% | 9,071 | 47.50% | 19,097 |
| Phelps | 5,637 | 28.81% | 13,480 | 68.89% | 451 | 2.30% | 7,843 | 40.08% | 19,568 |
| Pike | 1,717 | 22.31% | 5,863 | 76.19% | 115 | 1.49% | 4,146 | 53.88% | 7,695 |
| Platte | 27,179 | 47.46% | 28,917 | 50.49% | 1,174 | 2.05% | 1,738 | 3.03% | 57,270 |
| Polk | 2,885 | 19.15% | 11,850 | 78.66% | 329 | 2.18% | 8,965 | 59.51% | 15,064 |
| Pulaski | 3,740 | 25.95% | 10,329 | 71.66% | 345 | 2.39% | 6,589 | 45.71% | 14,414 |
| Putnam | 361 | 15.29% | 1,984 | 84.03% | 16 | 0.68% | 1,623 | 68.74% | 2,361 |
| Ralls | 1,205 | 21.28% | 4,396 | 77.64% | 61 | 1.08% | 3,191 | 56.36% | 5,662 |
| Randolph | 2,485 | 23.13% | 8,018 | 74.63% | 241 | 2.24% | 5,533 | 51.50% | 10,744 |
| Ray | 3,109 | 26.69% | 8,345 | 71.64% | 195 | 1.67% | 5,236 | 44.95% | 11,649 |
| Reynolds | 529 | 16.04% | 2,733 | 82.87% | 36 | 1.09% | 2,204 | 66.83% | 3,298 |
| Ripley | 833 | 14.57% | 4,839 | 84.64% | 45 | 0.79% | 4,006 | 70.07% | 5,717 |
| Saline | 2,904 | 30.51% | 6,451 | 67.77% | 164 | 1.72% | 3,547 | 37.26% | 9,519 |
| Schuyler | 373 | 18.62% | 1,606 | 80.18% | 24 | 1.20% | 1,233 | 61.56% | 2,003 |
| Scotland | 388 | 19.56% | 1,560 | 78.63% | 36 | 1.81% | 1,172 | 59.07% | 1,984 |
| Scott | 3,753 | 21.18% | 13,769 | 77.71% | 197 | 1.11% | 10,016 | 56.53% | 17,719 |
| Shannon | 706 | 18.07% | 3,165 | 81.03% | 35 | 0.90% | 2,459 | 62.95% | 3,906 |
| Shelby | 592 | 17.67% | 2,700 | 80.60% | 58 | 1.73% | 2,108 | 62.93% | 3,350 |
| St. Charles | 89,530 | 40.33% | 128,389 | 57.83% | 4,098 | 1.85% | 38,859 | 17.50% | 222,017 |
| St. Clair | 988 | 19.86% | 3,932 | 79.05% | 54 | 1.09% | 2,944 | 59.19% | 4,974 |
| St. Francois | 7,044 | 25.16% | 20,511 | 73.25% | 446 | 1.59% | 13,467 | 48.09% | 28,001 |
| St. Louis | 328,151 | 61.17% | 199,493 | 37.19% | 8,802 | 1.64% | -128,658 | -23.98% | 536,446 |
| St. Louis City | 110,089 | 82.24% | 21,474 | 16.04% | 2,304 | 1.72% | -88,615 | -66.20% | 133,867 |
| Ste. Genevieve | 2,713 | 28.61% | 6,630 | 69.91% | 141 | 1.49% | 3,917 | 41.30% | 9,484 |
| Stoddard | 1,819 | 13.55% | 11,484 | 85.54% | 123 | 0.92% | 9,665 | 71.99% | 13,426 |
| Stone | 3,506 | 18.97% | 14,800 | 80.07% | 177 | 0.96% | 11,294 | 61.10% | 18,483 |
| Sullivan | 478 | 19.34% | 1,974 | 79.89% | 19 | 0.77% | 1,496 | 60.54% | 2,471 |
| Taney | 5,339 | 20.31% | 20,508 | 78.01% | 441 | 1.68% | 15,169 | 57.70% | 26,288 |
| Texas | 1,716 | 15.17% | 9,478 | 83.76% | 121 | 1.07% | 7,762 | 68.60% | 11,315 |
| Vernon | 1,903 | 20.72% | 7,155 | 77.90% | 127 | 1.38% | 5,252 | 57.18% | 9,185 |
| Warren | 4,769 | 25.95% | 13,222 | 71.96% | 384 | 2.09% | 8,453 | 46.00% | 18,375 |
| Washington | 1,804 | 18.08% | 8,047 | 80.66% | 125 | 1.25% | 6,243 | 62.58% | 9,976 |
| Wayne | 845 | 14.38% | 4,987 | 84.84% | 46 | 0.78% | 4,142 | 70.47% | 5,878 |
| Webster | 3,573 | 19.03% | 14,880 | 79.24% | 326 | 1.74% | 11,307 | 60.21% | 18,779 |
| Worth | 215 | 19.42% | 877 | 79.22% | 15 | 1.36% | 662 | 59.80% | 1,107 |
| Wright | 1,168 | 13.37% | 7,453 | 85.28% | 118 | 1.35% | 6,285 | 71.92% | 8,739 |
| Total | 1,253,014 | 41.41% | 1,718,736 | 56.80% | 54,212 | 1.79% | 465,722 | 15.39% | 3,025,962 |
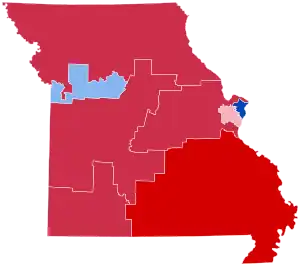
By congressional district
Trump won 6 of 8 congressional districts.[24]
| District | Trump | Biden | Representative |
|---|---|---|---|
| 1st | 18.1% | 80.3% | Lacy Clay (116th Congress) |
| Cori Bush (117th Congress) | |||
| 2nd | 49.18% | 49.16% | Ann Wagner |
| 3rd | 66.9% | 31.3% | Blaine Luetkemeyer |
| 4th | 66% | 31.9% | Vicky Hartzler |
| 5th | 39.6% | 58.4% | Emanuel Cleaver |
| 6th | 63.3% | 35% | Sam Graves |
| 7th | 70% | 28.1% | Billy Long |
| 8th | 77.3% | 21.4% | Jason Smith |
Analysis
A bellwether state for the bulk of the 20th century, Missouri has since come to vote reliably Republican in presidential elections. This has been attributed to a shift in Republican policy towards right-wing populism and social conservatism; the platform has found fertile ground in the state, which lies in the Bible Belt, with Trump carrying 86% of White, born-again/Evangelical Christians.[25]
Biden won the same four jurisdictions that Barack Obama and Hillary Clinton did in 2012 and 2016, respectively: Jackson County, home to Kansas City; Boone County, home to the college town of Columbia; and St. Louis County, home to the suburbs of St. Louis, which he also won. Biden also improved Democratic margins in Platte and Clay counties, both suburbs of Kansas City; Platte was carried by Trump by only 3%, and Clay by 4%. In addition, the 61% of the vote that Biden won in St. Louis County was the best performance for a Democrat since Lyndon B. Johnson's 1964 landslide.
Per exit polls by the Associated Press, Trump's strength in Missouri came from voters who trusted him on economic policy: a 57% majority believed Trump was better able to handle international trade. With a hybrid industrial-service-agricultural economy, 63% of Missourian voters favored increasing taxes on goods imported to the U.S. from other countries, and these voters broke for Trump by 67%. As is the case in many Southern and border states, there was a stark racial divide in voting for this election: White Missourians supported Trump by 62%, while black Missourians supported Biden by 88%. Trump became the first-ever Republican presidential candidate to win Missouri by double digits twice.[25]
In other elections, incumbent Republican Mike Parson easily defeated State Auditor Nicole Galloway by 16 points—outperforming Trump—in the governor's race, further testifying to the state's trend towards the GOP, and becoming the best performance for a Republican on the gubernatorial level since John Ashcroft's 1988 victory.
See also
Notes
- ↑ Calculated by taking the difference of 100% and all other candidates combined.
- 1 2 3 4 5 6 7 8 Key:
A – all adults
RV – registered voters
LV – likely voters
V – unclear - ↑ Overlapping sample with the previous SurveyMonkey/Axios poll, but more information available regarding sample size
- ↑ "Someone else" with 5%
- ↑ "Another Party Candidate" with 1%
- ↑ "Someone else" with 3%
- Partisan clients
- 1 2 Poll sponsored by Galloway's campaign for governor
- 1 2 Uniting Missouri is a PAC supporting Governor Mike Parson (R) in the 2020 Missouri gubernatorial election.
References
- ↑ Kelly, Ben (August 13, 2018). "US elections key dates: When are the 2018 midterms and the 2020 presidential campaign?". The Independent. Archived from the original on August 2, 2018. Retrieved January 3, 2019.
- ↑ "Distribution of Electoral Votes". National Archives and Records Administration. Retrieved January 3, 2019.
- ↑ "State of Missouri - Presidential Primary Election, March 10, 2020" (PDF). Missouri Secretary of State. Retrieved August 12, 2020.
- ↑ "Associated Press Election Services - Delegate Tracker". Associated Press. Retrieved November 23, 2022.
- ↑ "Missouri Republican Delegation 2020". The Green Papers. Retrieved March 11, 2020.
- ↑ "Joe Biden, Donald Trump win Missouri Presidential Preferential Primary". KMBC. March 10, 2020. Retrieved March 10, 2020.
- ↑ "Candidate List — March 2020 Presidential Preference Primary". Retrieved December 18, 2019.
- ↑ "2020 POTUS Race ratings" (PDF). The Cook Political Report. Retrieved May 21, 2019.
- ↑ "POTUS Ratings | Inside Elections". insideelections.com. Retrieved May 21, 2019.
- ↑ "Larry J. Sabato's Crystal Ball » 2020 President". crystalball.centerforpolitics.org. Retrieved May 21, 2019.
- ↑ "2020 Election Forecast". Politico. November 19, 2019.
- ↑ "Battle for White House". RCP. April 19, 2019.
- ↑ 2020 Bitecofer Model Electoral College Predictions Archived April 23, 2020, at the Wayback Machine, Niskanen Center, March 24, 2020, retrieved: April 19, 2020.
- ↑ David Chalian; Terence Burlij (June 11, 2020). "Road to 270: CNN's debut Electoral College map for 2020". CNN. Retrieved June 16, 2020.
- ↑ "Forecasting the US elections". The Economist. Retrieved July 7, 2020.
- ↑ "2020 Election Battleground Tracker". CBS News. July 12, 2020. Retrieved July 13, 2020.
- ↑ "2020 Presidential Election Interactive Map". 270 to Win.
- ↑ "ABC News Race Ratings". CBS News. July 24, 2020. Retrieved July 24, 2020.
- ↑ Montanaro, Domenico (August 3, 2020). "2020 Electoral Map Ratings: Trump Slides, Biden Advantage Expands Over 270 Votes". NPR.org. Retrieved August 3, 2020.
- ↑ "Biden dominates the electoral map, but here's how the race could tighten". NBC News. August 6, 2020. Retrieved August 6, 2020.
- ↑ "2020 Election Forecast". FiveThirtyEight. August 12, 2020. Retrieved August 14, 2020.
- ↑ "Official List of Candidates" (PDF). Missouri Secretary of State. Archived from the original (PDF) on September 1, 2020. Retrieved September 17, 2020.
- ↑ General Election, November 03, 2020, Official Results, Missouri Secretary of State, December 8, 2020.
- ↑ "Introducing the 2017 Cook Political Report Partisan Voter Index". The Cook Political Report.
- 1 2 "Missouri Voter Surveys: How Different Groups Voted". The New York Times. November 3, 2020. ISSN 0362-4331. Retrieved November 9, 2020.
Further reading
- Summary: State Laws on Presidential Electors (PDF), Washington DC: National Association of Secretaries of State, August 2020,
Missouri
External links
- Government Documents Round Table of the American Library Association, "Missouri", Voting & Elections Toolkits
- "Missouri: Election Tools, Deadlines, Dates, Rules, and Links", Vote.org, Oakland, CA
- "League of Women Voters of Missouri". (State affiliate of the U.S. League of Women Voters)
- Missouri at Ballotpedia