| |||||||||||||||||||||||||||||||||||||||||||||||||||||||||||||||||||||||||||||
16 out of 49 seats to Thurrock Council 25 seats needed for a majority | |||||||||||||||||||||||||||||||||||||||||||||||||||||||||||||||||||||||||||||
|---|---|---|---|---|---|---|---|---|---|---|---|---|---|---|---|---|---|---|---|---|---|---|---|---|---|---|---|---|---|---|---|---|---|---|---|---|---|---|---|---|---|---|---|---|---|---|---|---|---|---|---|---|---|---|---|---|---|---|---|---|---|---|---|---|---|---|---|---|---|---|---|---|---|---|---|---|---|
| |||||||||||||||||||||||||||||||||||||||||||||||||||||||||||||||||||||||||||||
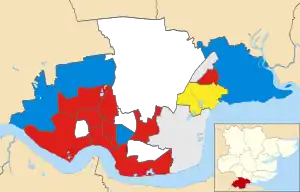
 Winner of each seat at the 2023 Thurrock Council election | |||||||||||||||||||||||||||||||||||||||||||||||||||||||||||||||||||||||||||||
| |||||||||||||||||||||||||||||||||||||||||||||||||||||||||||||||||||||||||||||
The 2023 Thurrock Council election took place on 4 May 2023 to elect a third of the members of Thurrock Council in Essex, England.[2] This was on the same day as other local elections across England.
The Conservatives narrowly retained their majority on the council at the election, but lost three seats compared to the position immediately before the election. The election was held in the context of the council having declared effective bankruptcy with debts of about £1.5 billion and a government-appointed commissioner having been installed to oversee the council's financial management. The Conservative leader of the council, Mark Coxshall, and the cabinet member for finance, Shane Hebb, were two of the three who lost their seats.[3][4] At the subsequent annual council meeting on 24 May 2023, Andrew Jefferies was appointed the new leader.[5]
Summary
Election result
| 2023 Thurrock Council election | ||||||||||
|---|---|---|---|---|---|---|---|---|---|---|
| Party | This election | Full council | This election | |||||||
| Seats | Net | Seats % | Other | Total | Total % | Votes | Votes % | +/− | ||
| Conservative | 4 | 25.0 | 22 | 26 | 53.1 | 8,490 | 32.4 | –15.7 | ||
| Labour | 9 | 56.3 | 10 | 19 | 38.8 | 11,833 | 45.1 | –3.0 | ||
| Independent | 2 | 12.5 | 1 | 3 | 6.1 | 2,633 | 10.0 | +7.8 | ||
| Thurrock Ind. | 1 | 6.3 | 0 | 1 | 2.0 | 2,706 | 10.3 | +8.6 | ||
| Reform UK | 0 | 0.0 | 0 | 0 | 0.0 | 436 | 1.7 | N/A | ||
| UKIP | 0 | 0.0 | 0 | 0 | 0.0 | 79 | 0.3 | N/A | ||
| Green | 0 | 0.0 | 0 | 0 | 0.0 | 64 | 0.2 | N/A | ||
Ward results
The Statement of Persons Nominated, which details the candidates standing in each ward, was released by Thurrock Council following the close of nomination on 5 April 2023.[6]
Seat changes are relative to the 2019 election and do not take into account any interim by-elections or defections. Vote share changes are relative to the last time the seat was up for election.
Aveley & Uplands
| Party | Candidate | Votes | % | ±% | |
|---|---|---|---|---|---|
| Conservative | Jacqui Maney | 928 | 52.7 | +3.3 | |
| Labour | Cathy Sisterson | 834 | 47.3 | –3.3 | |
| Majority | 96 | 5.4 | N/A | ||
| Turnout | 1,777 | 23.6 | +0.3 | ||
| Registered electors | 7,519 | ||||
| Conservative hold | Swing | ||||
Belhus
| Party | Candidate | Votes | % | ±% | |
|---|---|---|---|---|---|
| Labour | Mark Hurrell | 765 | 48.5 | –0.3 | |
| Conservative | Abbie Akinbohun | 433 | 27.5 | –23.7 | |
| Thurrock Ind. | Chris Baker* | 299 | 19.0 | N/A | |
| UKIP | Michael Keal | 79 | 5.0 | N/A | |
| Majority | 332 | 21.0 | N/A | ||
| Turnout | 1,579 | 21.9 | –1.9 | ||
| Registered electors | 7,210 | ||||
| Labour gain from Thurrock Ind. | Swing | ||||
Chadwell St. Mary
| Party | Candidate | Votes | % | ±% | |
|---|---|---|---|---|---|
| Labour | Daniel Chukwu* | 1,256 | 73.1 | +13.3 | |
| Conservative | Sophie Corcoran | 462 | 26.9 | –13.3 | |
| Majority | 794 | 46.2 | +26.6 | ||
| Turnout | 1,741 | 23.8 | –2.9 | ||
| Registered electors | 7,317 | ||||
| Labour hold | Swing | ||||
Chafford & North Stifford
| Party | Candidate | Votes | % | ±% | |
|---|---|---|---|---|---|
| Labour | Vikki Hartstean | 741 | 49.1 | +18.2 | |
| Conservative | Mark Coxshall* | 639 | 42.3 | –26.8 | |
| Reform UK | Sue Truman | 129 | 8.5 | N/A | |
| Majority | 102 | 6.8 | N/A | ||
| Turnout | 1,514 | 27.1 | |||
| Registered electors | 5,581 | ||||
| Labour gain from Conservative | Swing | ||||
Corringham & Fobbing
| Party | Candidate | Votes | % | ±% | |
|---|---|---|---|---|---|
| Conservative | Deborah Arnold | 555 | 39.0 | –31.3 | |
| Thurrock Ind. | John Fox | 545 | 38.3 | N/A | |
| Labour | Ngozi Alike | 324 | 22.8 | –6.9 | |
| Majority | 10 | 0.7 | –39.9 | ||
| Turnout | 1,427 | 32.5 | |||
| Registered electors | 4,391 | ||||
| Conservative hold | Swing | N/A | |||
East Tilbury
| Party | Candidate | Votes | % | ±% | |
|---|---|---|---|---|---|
| Independent | Fraser Massey* | 980 | 74.9 | N/A | |
| Labour | Alastair Craft | 245 | 18.7 | +2.0 | |
| Conservative | Daryl Palmer | 83 | 6.3 | –36.5 | |
| Majority | 735 | 56.2 | N/A | ||
| Turnout | 1,317 | 25.2 | |||
| Registered electors | 5,222 | ||||
| Independent hold | Swing | N/A | |||
Grays Riverside
| Party | Candidate | Votes | % | ±% | |
|---|---|---|---|---|---|
| Labour | Valerie Morris-Cook | 1,191 | 75.5 | +3.6 | |
| Conservative | Emily Folorunsho | 386 | 24.5 | –3.6 | |
| Majority | 805 | 51.0 | +7.2 | ||
| Turnout | 1,590 | 19.4 | –6.6 | ||
| Registered electors | 8,206 | ||||
| Labour hold | Swing | ||||
Grays Thurrock
| Party | Candidate | Votes | % | ±% | |
|---|---|---|---|---|---|
| Labour | Catherine Kent* | 1,151 | 68.6 | +0.5 | |
| Conservative | Elizabeth Alo | 343 | 20.5 | –11.4 | |
| Reform UK | Roy Grayson | 183 | 10.9 | N/A | |
| Majority | 808 | 48.1 | +11.9 | ||
| Turnout | 1,691 | 25.5 | –0.5 | ||
| Registered electors | 6,644 | ||||
| Labour hold | Swing | ||||
Little Thurrock Rectory
| Party | Candidate | Votes | % | ±% | |
|---|---|---|---|---|---|
| Conservative | Tom Kelly* | 580 | 39.7 | –16.0 | |
| Labour | Enayet Sarwar | 550 | 37.6 | –6.7 | |
| Thurrock Ind. | Russell Cherry | 332 | 22.7 | N/A | |
| Majority | 30 | 2.1 | –9.2 | ||
| Turnout | 1,467 | 32.3 | +1.8 | ||
| Registered electors | 4,539 | ||||
| Conservative hold | Swing | ||||
Ockendon
| Party | Candidate | Votes | % | ±% | |
|---|---|---|---|---|---|
| Conservative | Andrew Jefferies* | 1,014 | 48.3 | –5.5 | |
| Labour | Gary Watson | 839 | 39.9 | –6.3 | |
| Thurrock Ind. | Ross Byrne | 248 | 11.8 | N/A | |
| Majority | 175 | 8.4 | +0.8 | ||
| Turnout | 2,110 | 25.3 | +1.9 | ||
| Registered electors | 8,333 | ||||
| Conservative hold | Swing | ||||
Stanford East & Corringham Town
| Party | Candidate | Votes | % | ±% | |
|---|---|---|---|---|---|
| Labour | John Cecil | 667 | 37.2 | +7.7 | |
| Conservative | Shane Ralph* | 568 | 31.7 | –14.7 | |
| Independent | Roy Jones | 559 | 31.2 | N/A | |
| Majority | 99 | 5.5 | N/A | ||
| Turnout | 1,806 | 28.6 | +0.4 | ||
| Registered electors | 6,317 | ||||
| Labour gain from Thurrock Ind. | Swing | ||||
Stanford-le-Hope West
| Party | Candidate | Votes | % | ±% | |
|---|---|---|---|---|---|
| Independent | Neil Speight | 643 | 38.1 | N/A | |
| Labour | Philip Smith | 532 | 31.6 | +9.6 | |
| Conservative | Shane Hebb* | 511 | 30.3 | –20.1 | |
| Majority | 111 | 6.5 | N/A | ||
| Turnout | 1,691 | 30.5 | |||
| Registered electors | 5,537 | ||||
| Independent gain from Conservative | Swing | N/A | |||
Stifford Clays
| Party | Candidate | Votes | % | ±% | |
|---|---|---|---|---|---|
| Labour | Mark Hooper | 610 | 40.9 | –6.1 | |
| Conservative | Gavin Holland | 476 | 31.9 | –21.1 | |
| Thurrock Ind. | Jennifer Smith* | 340 | 22.8 | N/A | |
| Green | Jack Beauchamp-Stansfield | 64 | 4.3 | N/A | |
| Majority | 134 | 9.0 | N/A | ||
| Turnout | 1,498 | 29.9 | +1.2 | ||
| Registered electors | 5,006 | ||||
| Labour gain from Thurrock Ind. | Swing | ||||
The Homesteads
| Party | Candidate | Votes | % | ±% | |
|---|---|---|---|---|---|
| Thurrock Ind. | Gary Byrne* | 942 | 42.6 | N/A | |
| Conservative | Shamim Miah | 603 | 27.2 | –38.7 | |
| Labour | Tony Benson | 544 | 24.6 | –9.5 | |
| Reform UK | Bill Poskitt | 124 | 5.6 | N/A | |
| Majority | 339 | 15.4 | N/A | ||
| Turnout | 2,229 | 35.0 | +1.8 | ||
| Registered electors | 6,376 | ||||
| Thurrock Ind. hold | Swing | N/A | |||
Tilbury Riverside & Thurrock Park
| Party | Candidate | Votes | % | ±% | |
|---|---|---|---|---|---|
| Labour | Cici Manwa | 486 | 45.0 | +11.0 | |
| Independent | Craig Austin | 451 | 41.7 | N/A | |
| Conservative | Allen Mayes* | 144 | 13.3 | –9.2 | |
| Majority | 35 | 3.3 | N/A | ||
| Turnout | 1,083 | 22.4 | –4.0 | ||
| Registered electors | 4,826 | ||||
| Labour gain from Thurrock Ind. | Swing | N/A | |||
West Thurrock & South Stifford
| Party | Candidate | Votes | % | ±% | |
|---|---|---|---|---|---|
| Labour Co-op | Aaron Green | 1,098 | 58.9 | +12.6 | |
| Conservative | Tunde Ojetola | 765 | 41.1 | –12.6 | |
| Majority | 333 | 17.8 | N/A | ||
| Turnout | 1,892 | 21.2 | –3.5 | ||
| Registered electors | 8,908 | ||||
| Labour Co-op hold | Swing | ||||
References
- ↑ "Vote 2023". Thurrock Council. 5 May 2023. Retrieved 5 May 2023.
- ↑ "Notice of Election" (PDF). Thurrock Council. 24 March 2023. Retrieved 10 April 2023.
- ↑ Whitehouse, Ellis (5 May 2023). "Local Elections 2023: Thurrock Council leader loses seat as Conservatives take heavy losses". Essex Live. Retrieved 30 May 2023.
- ↑ "Local elections 2023: The electorate have given us a beating - Tory MP". BBC News. 5 May 2023. Retrieved 30 May 2023.
- ↑ "New Mayor and Leader". Thurrock Council. 25 May 2023. Retrieved 30 May 2023.
- ↑ "Statement of Persons Nominated" (PDF). Thurrock Council. 4 April 2023. Retrieved 10 April 2023.

