| |||||||||||||||||||||||||||||||||||||
14 of the 42 seats to Harlow District Council 17 seats needed for a majority | |||||||||||||||||||||||||||||||||||||
|---|---|---|---|---|---|---|---|---|---|---|---|---|---|---|---|---|---|---|---|---|---|---|---|---|---|---|---|---|---|---|---|---|---|---|---|---|---|
| |||||||||||||||||||||||||||||||||||||
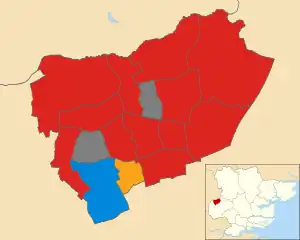
 Map showing the results of contested wards in the 1998 Harlow District Council elections. | |||||||||||||||||||||||||||||||||||||
| |||||||||||||||||||||||||||||||||||||
The 1998 Harlow District Council election took place on 7 May 1998 to elect members of Harlow District Council in Essex, England. One third of the council was up for election and the Labour party stayed in overall control of the council.[1]
After the election, the composition of the council was
Background
Before the election Labour had 40 of the 42 seats on the council, with only 2 Liberal Democrat councillors forming the opposition.[3] 3 Labour councillors stood down at the election from Katherines with Sumners, Netteswell West and Tye Green wards.[3]
Each of the Conservative, Labour and Liberal Democrats had candidates for all 15 seats contested at the election, with 2 seats available in Old Harlow ward.[3]
Election result
Labour held 13 of the 15 seats they had been defending, but the council chairman John Young was defeated in Kingsmoor ward by 21-year-old Conservative Andrew Johnson, who became the youngest councillor on the council.[4] The Liberal Democrats also regained Stewards from Labour, a seat they had previously lost at a by-election.[4]
| Party | Seats | Gains | Losses | Net gain/loss | Seats % | Votes % | Votes | +/− | |
|---|---|---|---|---|---|---|---|---|---|
| Labour | 13 | 0 | 2 | 86.7 | 53.0 | 8,305 | |||
| Conservative | 1 | 1 | 0 | 6.7 | 27.1 | 4,248 | |||
| Liberal Democrats | 1 | 1 | 0 | 6.7 | 19.9 | 3,124 | |||
All comparisons in vote share are to the corresponding 1994 election.
Ward results
Brays Grove

| Party | Candidate | Votes | % | |
|---|---|---|---|---|
| Labour | Annie Howard | 524 | 71.6 | |
| Conservative | Ronald Tweed | 119 | 16.3 | |
| Liberal Democrats | Ian Jackson | 89 | 12.2 | |
| Majority | 405 | 55.3 | ||
| Turnout | 732 | |||
| Labour hold | ||||
Hare Street

| Party | Candidate | Votes | % | |
|---|---|---|---|---|
| Labour | John Cave | 422 | 65.9 | |
| Conservative | David Roberts | 114 | 17.8 | |
| Liberal Democrats | Stanley Ward | 104 | 16.3 | |
| Majority | 308 | 48.1 | ||
| Turnout | 640 | |||
| Labour hold | ||||
Katherines with Sumners

| Party | Candidate | Votes | % | |
|---|---|---|---|---|
| Labour | Godfrey Hocking | 445 | 44.2 | |
| Conservative | Simon Carter | 419 | 41.6 | |
| Liberal Democrats | Harry Ackland-Snow | 143 | 14.2 | |
| Majority | 26 | 2.6 | ||
| Turnout | 1,007 | |||
| Labour hold | ||||
Kingsmoor

| Party | Candidate | Votes | % | |
|---|---|---|---|---|
| Conservative | Andrew Johnson | 576 | 43.4 | |
| Labour | John Young | 574 | 43.2 | |
| Liberal Democrats | Linda Jones | 178 | 13.4 | |
| Majority | 2 | 0.2 | ||
| Turnout | 1,328 | |||
| Conservative gain from Labour | ||||
Latton Bush

| Party | Candidate | Votes | % | |
|---|---|---|---|---|
| Labour | Alan Frost | 548 | 57.9 | |
| Conservative | Pamela Norton | 272 | 28.7 | |
| Liberal Democrats | Paul Lawton | 127 | 13.4 | |
| Majority | 276 | 29.1 | ||
| Turnout | 947 | |||
| Labour hold | ||||
Little Parndon

| Party | Candidate | Votes | % | |
|---|---|---|---|---|
| Labour | Mavis Carter | 648 | 67.6 | |
| Conservative | Charles Ross | 199 | 20.8 | |
| Liberal Democrats | Anthony Davis | 111 | 11.6 | |
| Majority | 449 | 46.9 | ||
| Turnout | 958 | |||
| Labour hold | ||||
Mark Hall North

| Party | Candidate | Votes | % | |
|---|---|---|---|---|
| Labour | Edith Morris | 426 | 62.8 | |
| Conservative | Anthony Gronland | 164 | 24.2 | |
| Liberal Democrats | Michael Atkinson | 88 | 13.0 | |
| Majority | 262 | 38.6 | ||
| Turnout | 678 | |||
| Labour hold | ||||
Mark Hall South

| Party | Candidate | Votes | % | |
|---|---|---|---|---|
| Labour | Caroline Vaughan | 603 | 54.1 | |
| Liberal Democrats | Glennis George | 400 | 35.9 | |
| Conservative | Dianne Crossingham | 111 | 10.0 | |
| Majority | 203 | 18.2 | ||
| Turnout | 1,114 | |||
| Labour hold | ||||
Netteswell West

| Party | Candidate | Votes | % | |
|---|---|---|---|---|
| Labour | Derek Eardley | 396 | 66.4 | |
| Liberal Democrats | Shiela Herbert | 110 | 18.5 | |
| Conservative | Sue Livings | 90 | 15.1 | |
| Majority | 286 | 48.0 | ||
| Turnout | 596 | |||
| Labour hold | ||||
Old Harlow (2 seats)

| Party | Candidate | Votes | % | |
|---|---|---|---|---|
| Labour | Jonathan Simcox | 780 | ||
| Labour | Jacqueline Sully | 749 | ||
| Conservative | Michael Garnett | 638 | ||
| Conservative | George Reynolds | 603 | ||
| Liberal Democrats | Gareth Higgins | 206 | ||
| Liberal Democrats | Nicholas Macy | 173 | ||
| Turnout | 3,149 | |||
| Labour hold | ||||
| Labour hold | ||||
Passmores

| Party | Candidate | Votes | % | |
|---|---|---|---|---|
| Labour | Rob Collyer | 574 | 63.6 | |
| Conservative | Andrew Shannon | 190 | 21.0 | |
| Liberal Democrats | David Arnold | 139 | 15.4 | |
| Majority | 384 | 42.5 | ||
| Turnout | 903 | |||
| Labour hold | ||||
Potter Street

| Party | Candidate | Votes | % | |
|---|---|---|---|---|
| Labour | Feroz Khan | 681 | 41.2 | |
| Conservative | Ronald Cross | 547 | 33.1 | |
| Liberal Democrats | William Arnott | 425 | 25.7 | |
| Majority | 134 | 8.1 | ||
| Turnout | 1,653 | |||
| Labour hold | ||||
Stewards

| Party | Candidate | Votes | % | |
|---|---|---|---|---|
| Liberal Democrats | Audrey Curran | 704 | 64.9 | |
| Labour | Gregory Peck | 311 | 28.7 | |
| Conservative | Stephen Butt | 69 | 6.4 | |
| Majority | 393 | 36.3 | ||
| Turnout | 1,084 | |||
| Liberal Democrats gain from Labour | ||||
Tye Green

| Party | Candidate | Votes | % | |
|---|---|---|---|---|
| Labour | Margaret Hickey | 624 | 70.3 | |
| Conservative | Vivien Ross | 137 | 15.4 | |
| Liberal Democrats | Valerie Scott | 127 | 14.3 | |
| Majority | 487 | 54.8 | ||
| Turnout | 888 | |||
| Labour hold | ||||
References
- 1 2 "Local Elections results". The Times. 9 May 1998. p. 46.
- ↑ "Policy and politics: Local Elections: Analysis: Council poll results". The Guardian. 9 May 1998. p. 16.
- 1 2 3 "Let battle commence". Greater London, Kent, and Surrey Counties Publications. NewsBank. 9 May 1998.
- 1 2 3 4 5 6 7 8 9 10 11 12 13 14 15 16 17 "Results of Harlow local elections 1998". Greater London, Kent and Surrey County Publications. NewsBank. 9 May 1998.