| |||||||||||||||||||||||||||||||||
16 of the 42 seats to Basildon District Council 22 seats needed for a majority | |||||||||||||||||||||||||||||||||
|---|---|---|---|---|---|---|---|---|---|---|---|---|---|---|---|---|---|---|---|---|---|---|---|---|---|---|---|---|---|---|---|---|---|
| |||||||||||||||||||||||||||||||||
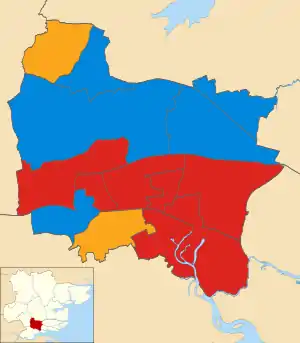 Map showing the results of contested wards in the 1998 Basildon Borough Council elections. | |||||||||||||||||||||||||||||||||
| |||||||||||||||||||||||||||||||||
The 1998 Basildon District Council election took place on 7 May 1998 to elect members of Basildon District Council in Essex, England. One third of the council was up for election and the Labour party stayed in overall control of the council.[3]
After the election, the composition of the council was
- Labour 23
- Liberal Democrats 13
- Conservative 6[3]
Election result
| Party | Seats | Gains | Losses | Net gain/loss | Seats % | Votes % | Votes | +/− | |
|---|---|---|---|---|---|---|---|---|---|
| Labour | 9 | 0 | 1 | 56.3 | 39.5 | 12,464 | |||
| Conservative | 5 | 4 | 0 | 31.3 | 35.0 | 11,046 | |||
| Liberal Democrats | 2 | 0 | 3 | 12.5 | 25.3 | 7,993 | |||
| Socialist Alliance | 0 | 0 | 0 | 0.0 | 0.2 | 59 | New | ||
All comparisons in vote share are to the corresponding 1994 election.
Ward results
Billericay East
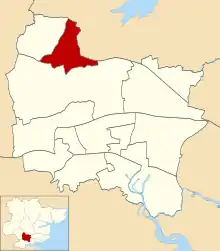
Location of Billericay East ward
| Party | Candidate | Votes | % | |
|---|---|---|---|---|
| Conservative | Peter Patrick[6] | 1,205 | 51.9% | |
| Liberal Democrats | R. Dowden | 815 | 35.1% | |
| Labour | P. Reid | 301 | 13.0% | |
| Turnout | 26.2% | |||
| Conservative gain from Liberal Democrats | ||||
Billericay West

Location of Billericay West ward
| Party | Candidate | Votes | % | |
|---|---|---|---|---|
| Liberal Democrats | Michael Barr[7] | 1,231 | 46.0% | |
| Conservative | S. Horgan | 1,196 | 44.7% | |
| Labour | R. Austin | 248 | 9.3% | |
| Turnout | 25.7% | |||
| Liberal Democrats hold | ||||
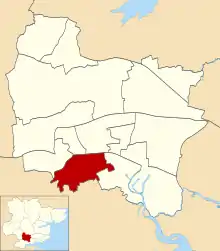
Burstead

Location of Burstead ward
| Party | Candidate | Votes | % | |
|---|---|---|---|---|
| Conservative | Geoffrey Buckenham[8] | 1,061 | 45.8% | |
| Liberal Democrats | G. Taylor | 908 | 39.2% | |
| Labour | M. Viney | 348 | 15.0% | |
| Turnout | 26.4% | |||
| Conservative gain from Liberal Democrats | ||||
Fryerns Central

Location of Fryerns Central ward
| Party | Candidate | Votes | % | |
|---|---|---|---|---|
| Labour | Paul Kirkman[9] | 1,424 | 72.1% | |
| Conservative | A. Hedley | 324 | 16.4% | |
| Liberal Democrats | M. Dickinson | 226 | 11.4% | |
| Turnout | 24.7% | |||
| Labour hold | ||||
Fryerns East

Location of Fryerns East ward
| Party | Candidate | Votes | % | |
|---|---|---|---|---|
| Labour | John Potter[10] | 1,261 | 73.1% | |
| Conservative | D. Morris | 321 | 18.6% | |
| Liberal Democrats | J. Lutton | 144 | 8.3% | |
| Turnout | 22.4% | |||
| Labour hold | ||||
Laindon

Location of Laindon ward
| Party | Candidate | Votes | % | |
|---|---|---|---|---|
| Labour | Colin Payn[11] | 1,158 | 51.6% | |
| Conservative | D. Walsh | 812 | 36.2% | |
| Liberal Democrats | V. Howard | 275 | 12.2% | |
| Turnout | 23.2% | |||
| Labour hold | ||||
Langdon Hills

Location of Langdon Hills ward
| Party | Candidate | Votes | % | |
|---|---|---|---|---|
| Conservative | S. Hillier | 1,191 | 45.3% | |
| Labour | M. Larkin | 1,176 | 44.7% | |
| Liberal Democrats | L. Williams | 261 | 9.9% | |
| Turnout | 27.4% | |||
| Conservative gain from Labour | ||||
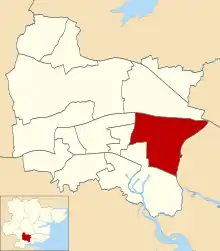
Lee Chapel

Location of Lee Chapel North ward
| Party | Candidate | Votes | % | |
|---|---|---|---|---|
| Labour | Nigel Smith[12] | 1,309 | 63.6% | |
| Conservative | M. Levey | 474 | 23.0% | |
| Liberal Democrats | M. Dale | 274 | 13.3% | |
| Turnout | 27.3% | |||
| Labour hold | ||||
Nethermayne
Location of Nethermayne ward
| Party | Candidate | Votes | % | |
|---|---|---|---|---|
| Liberal Democrats | Geoff Williams[13] | 1,431 | 54.2% | |
| Labour | T. Lomas | 747 | 28.3% | |
| Conservative | S. Allen | 460 | 17.4% | |
| Turnout | 38.7% | |||
| Liberal Democrats hold | ||||
Pitsea East
Location of Pitsea East ward
| Party | Candidate | Votes | % | |
|---|---|---|---|---|
| Labour | Dave Marks[14] | 1,187 | ||
| Labour | R. Rackham | 1,040 | ||
| Conservative | K. Blake | 860 | ||
| Conservative | P. Turner | 796 | ||
| Liberal Democrats | D. Birch | 209 | ||
| Liberal Democrats | A. Ferriss | 171 | ||
| Socialist Alliance | D. Murray | 59 | ||
| Turnout | 21.6% | |||
| Labour hold | ||||
Pitsea West

Location of Pitsea West ward
| Party | Candidate | Votes | % | |
|---|---|---|---|---|
| Labour | P. Ballard | 1,140 | 66.4% | |
| Conservative | C. Coombes | 395 | 23.0% | |
| Liberal Democrats | J. Barr | 183 | 10.7% | |
| Turnout | 20.4% | |||
| Labour hold | ||||
Vange

Location of Vange ward
| Party | Candidate | Votes | % | |
|---|---|---|---|---|
| Labour | F. Kirkman | 909 | ||
| Labour | L. Rossati | 873 | ||
| Conservative | R. Cornish | 349 | ||
| Conservative | S. Hillier | 319 | ||
| Liberal Democrats | P. Jenkins | 137 | ||
| Liberal Democrats | T. Marsh | 124 | ||
| Turnout | 18.1% | |||
| Labour hold | ||||
Wickford North

Location of Wickford North ward
| Party | Candidate | Votes | % | |
|---|---|---|---|---|
| Conservative | Tony Ball[15] | 1,052 | 38.8% | |
| Liberal Democrats | M. Birch | 1,042 | 38.5% | |
| Labour | C. Wilson | 614 | 22.7% | |
| Turnout | 29.2% | |||
| Conservative gain from Liberal Democrats | ||||
Wickford South

Location of Wickford South ward
| Party | Candidate | Votes | % | |
|---|---|---|---|---|
| Conservative | Sylvia Buckley[16] | 1,346 | 47.3% | |
| Liberal Democrats | J. Pattison | 857 | 30.1% | |
| Labour | A. Ede | 642 | 22.6% | |
| Turnout | 25.1% | |||
| Conservative gain from Liberal Democrats | ||||
References
- ↑ "Council compositions by year". The Elections Centre.
- ↑ "Local Election Summaries 1998". The Elections Centre.
- 1 2 "Policy and politics: Local Elections: Analysis: Council poll results". The Guardian. 9 May 1998. p. 16.
- ↑ "Local Elections results". The Times. 9 May 1998. p. 46.
- 1 2 3 4 5 6 7 8 9 10 11 12 13 14 "Basildon District Council Election Results 1973–2012" (PDF). Elections Centre. Retrieved 3 August 2019.
- ↑ "Billericay East". Basildon District Council. Archived from the original on 25 May 2001. Retrieved 12 October 2019.
- ↑ "Billericay West". Basildon District Council. Archived from the original on 18 November 2001. Retrieved 12 October 2019.
- ↑ "Burstead". Basildon District Council. Archived from the original on 7 July 2001. Retrieved 12 October 2019.
- ↑ "Fryerns Central". Basildon District Council. Archived from the original on 24 February 2002. Retrieved 12 October 2019.
- ↑ "Fryerns East". Basildon District Council. Archived from the original on 25 May 2001. Retrieved 12 October 2019.
- ↑ "Laindon". Basildon District Council. Archived from the original on 25 May 2001. Retrieved 12 October 2019.
- ↑ "Billericay West". Basildon District Council. Archived from the original on 25 May 2001. Retrieved 12 October 2019.
- ↑ "Nethermayne". Basildon District Council. Archived from the original on 25 May 2001. Retrieved 12 October 2019.
- ↑ "Pitsea East". Basildon District Council. Archived from the original on 25 May 2001. Retrieved 12 October 2019.
- ↑ "Wickford North". Basildon District Council. Archived from the original on 18 November 2001. Retrieved 12 October 2019.
- ↑ "Wickford South". Basildon District Council. Archived from the original on 6 October 2001. Retrieved 12 October 2019.
This article is issued from Wikipedia. The text is licensed under Creative Commons - Attribution - Sharealike. Additional terms may apply for the media files.