| Solar eclipse of October 23, 1976 | |
|---|---|
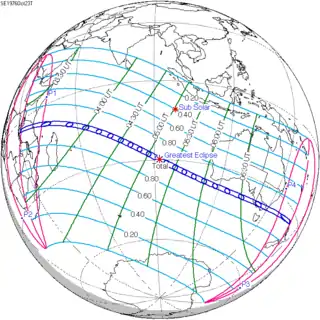 Map | |
| Type of eclipse | |
| Nature | Total |
| Gamma | −0.327 |
| Magnitude | 1.0572 |
| Maximum eclipse | |
| Duration | 286 sec (4 m 46 s) |
| Coordinates | 30°00′S 92°18′E / 30°S 92.3°E |
| Max. width of band | 199 km (124 mi) |
| Times (UTC) | |
| Greatest eclipse | 5:13:45 |
| References | |
| Saros | 133 (43 of 72) |
| Catalog # (SE5000) | 9457 |
A total solar eclipse occurred at the Moon's ascending node of the orbit on Saturday, October 23, 1976. A solar eclipse occurs when the Moon passes between Earth and the Sun, thereby totally or partly obscuring the image of the Sun for a viewer on Earth. A total solar eclipse occurs when the Moon's apparent diameter is larger than the Sun's, blocking all direct sunlight, turning day into darkness. Totality occurs in a narrow path across Earth's surface, with the partial solar eclipse visible over a surrounding region thousands of kilometres wide. This total solar eclipse began at sunrise in Tanzania near the border with Burundi, with the path of totality passing just north of the large Tanzanian city of Dar es Salaam. It then crossed the Indian Ocean, passing St. Pierre Island, Providence Atoll and Farquhar Atoll of Seychelles before making landfall in southeastern Australia. The largest city that saw totality was Melbourne. After leaving the Australian mainland, the path of totality left the Earth's surface just north of the north island of New Zealand.
Related eclipses
Eclipses in 1976
- An annular solar eclipse on Thursday, 29 April 1976.
- A partial lunar eclipse on Thursday, 13 May 1976.
- A total solar eclipse on Saturday, 23 October 1976.
- A penumbral lunar eclipse on Saturday, 6 November 1976.
Solar eclipses of 1975–1978
There were 8 solar eclipses (at 6 month intervals) between May 11, 1975 and October 2, 1978.
| Solar eclipse series sets from 1975–1978 | ||||||
|---|---|---|---|---|---|---|
| Descending node | Ascending node | |||||
| Saros | Map | Gamma | Saros | Map | Gamma | |
| 118 | 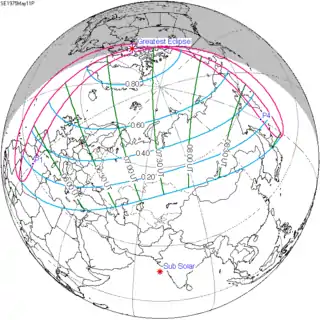 1975 May 11 Partial | 1.06472 | 123 | 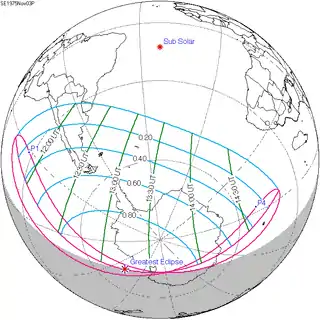 1975 November 3 Partial | −1.02475 | |
| 128 | 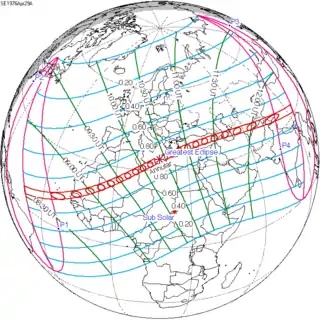 1976 April 29 Annular | 0.33783 | 133 |  1976 October 23 Total | −0.32699 | |
| 138 | 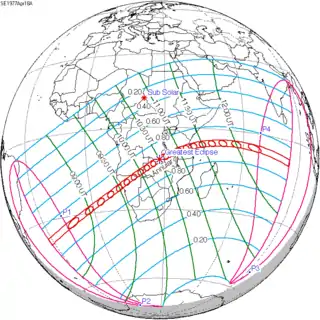 1977 April 18 Annular | −0.39903 | 143 | 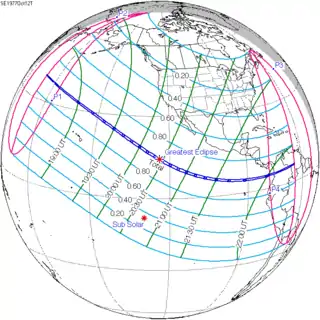 1977 October 12 Total | 0.38363 | |
| 148 | 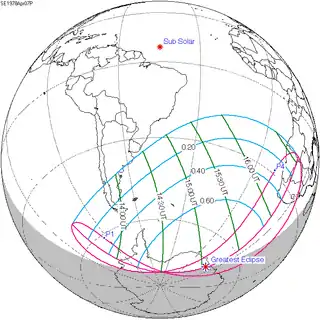 1978 April 7 Partial | −1.10812 | 153 |  1978 October 2 Partial | 1.16164 | |
Saros 133
Solar Saros 133, repeating every 18 years, 11 days, contains 72 events. The series started with a partial solar eclipse on July 13, 1219. It contains annular eclipses from November 20, 1435, through January 13, 1526, with a hybrid eclipse on January 24, 1544. It has total eclipses from February 3, 1562, through June 21, 2373. The series ends at member 72 as a partial eclipse on September 5, 2499. The longest duration of totality was 6 minutes, 49.97 seconds on August 7, 1850.[1] The total eclipses of this saros series are getting shorter and farther south with each iteration. All eclipses in this series occurs at the Moon’s ascending node.
| Series members 30–56 occur between 1742 and 2211 | ||
|---|---|---|
| 30 | 31 | 32 |
| June 3, 1742 | June 13, 1760 | 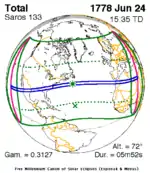 June 24, 1778 |
| 33 | 34 | 35 |
| July 4, 1796 | July 17, 1814 | July 27, 1832 |
| 36 | 37 | 38 |
| August 7, 1850 | 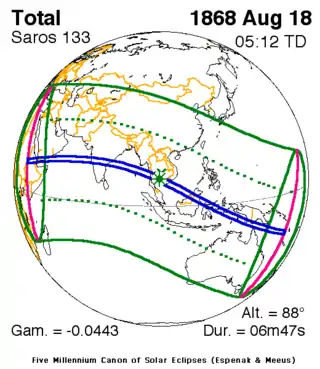 August 18, 1868 |
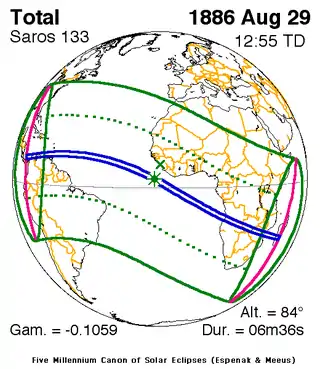 August 29, 1886 |
| 39 | 40 | 41 |
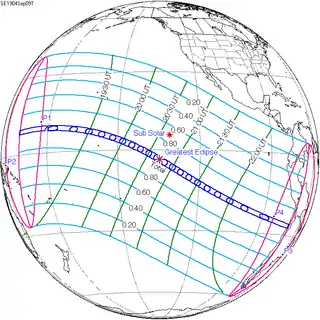 September 9, 1904 |
 September 21, 1922 |
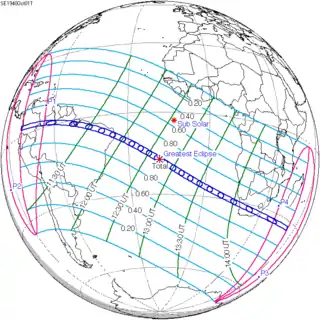 October 1, 1940 |
| 42 | 43 | 44 |
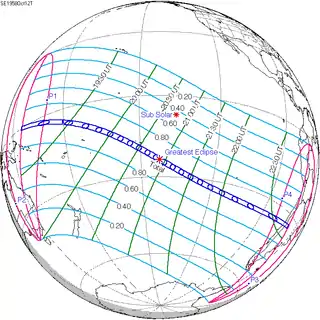 October 12, 1958 |
 October 23, 1976 |
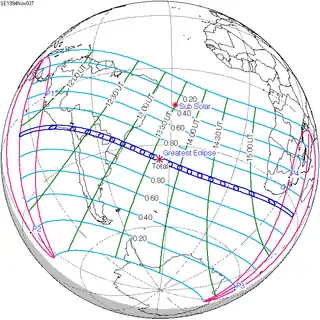 November 3, 1994 |
| 45 | 46 | 47 |
 November 13, 2012 |
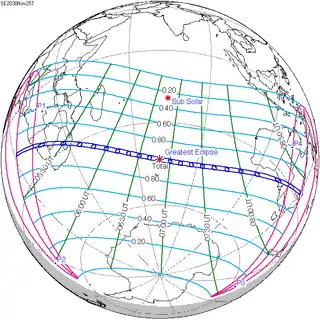 November 25, 2030 |
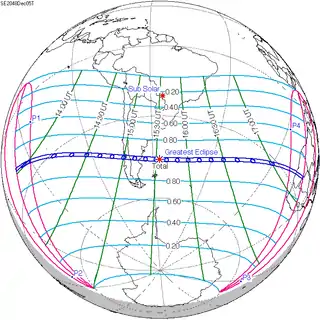 December 5, 2048 |
| 48 | 49 | 50 |
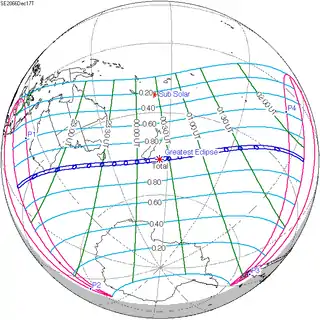 December 17, 2066 |
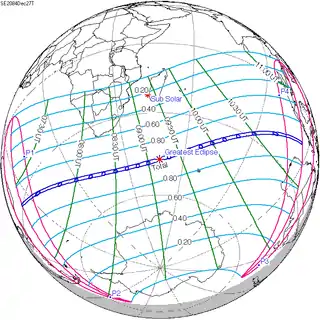 December 27, 2084 |
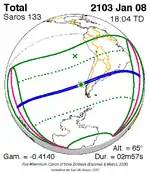 January 8, 2103 |
| 51 | 52 | 53 |
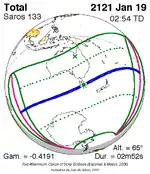 January 19, 2121 |
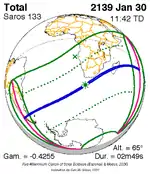 January 30, 2139 |
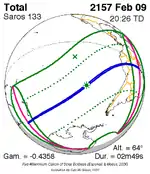 February 9, 2157 |
| 54 | 55 | 56 |
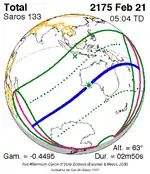 February 21, 2175 |
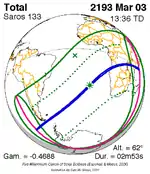 March 3, 2193 |
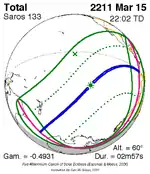 March 15, 2211 |
Metonic series
The metonic series repeats eclipses every 19 years (6939.69 days), lasting about 5 cycles. Eclipses occur in nearly the same calendar date. In addition, the octon subseries repeats 1/5 of that or every 3.8 years (1387.94 days). All eclipses in this table occur at the Moon's ascending node.
| 22 eclipse events between January 5, 1935 and August 11, 2018 | ||||
|---|---|---|---|---|
| January 4-5 | October 23-24 | August 10-12 | May 30-31 | March 18-19 |
| 111 | 113 | 115 | 117 | 119 |
 January 5, 1935 |
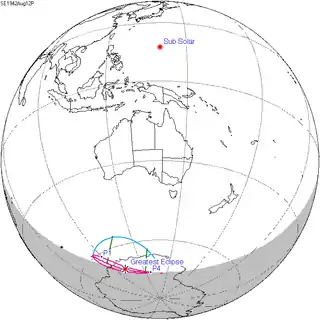 August 12, 1942 |
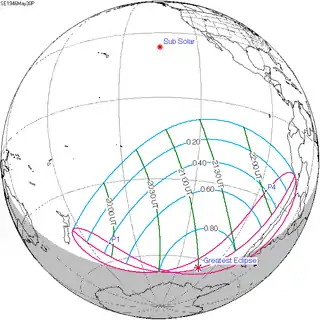 May 30, 1946 |
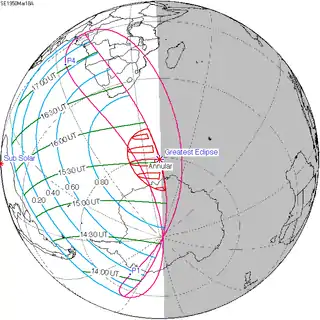 March 18, 1950 | |
| 121 | 123 | 125 | 127 | 129 |
 January 5, 1954 |
 October 23, 1957 |
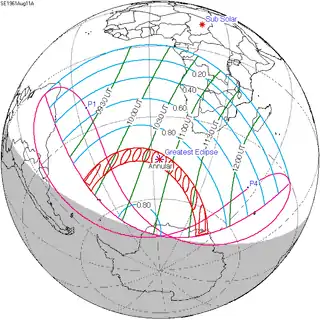 August 11, 1961 |
 May 30, 1965 |
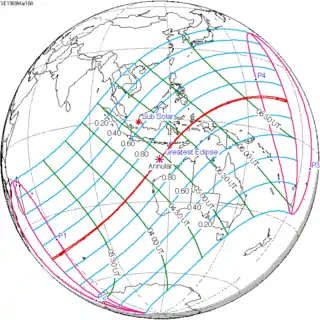 March 18, 1969 |
| 131 | 133 | 135 | 137 | 139 |
 January 4, 1973 |
 October 23, 1976 |
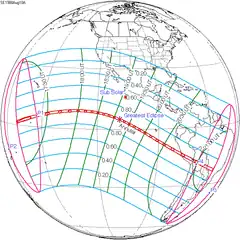 August 10, 1980 |
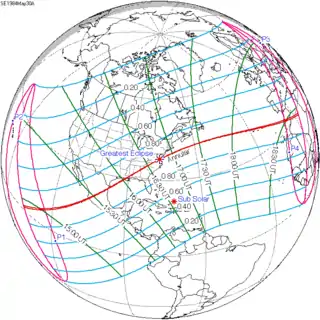 May 30, 1984 |
 March 18, 1988 |
| 141 | 143 | 145 | 147 | 149 |
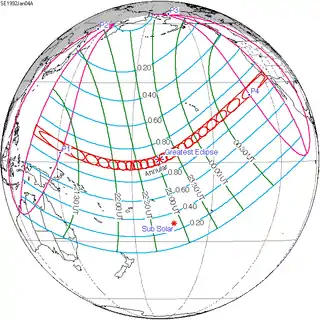 January 4, 1992 |
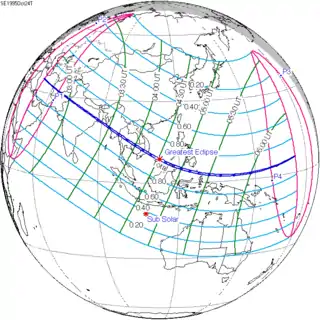 October 24, 1995 |
 August 11, 1999 |
 May 31, 2003 |
 March 19, 2007 |
| 151 | 153 | 155 | ||
 January 4, 2011 |
 October 23, 2014 |
 August 11, 2018 |
||
References
External links
- Earth visibility chart and eclipse statistics Eclipse Predictions by Fred Espenak, NASA/GSFC
.jpg.webp)

